
In this article, we’ll demonstrate how to create a machine learning model for predicting buy and sell signals in the ETH/USD market using a Random Forest algorithm. We’ll walk through the entire process, from importing libraries and data, to preprocessing, feature engineering, model training, hyperparameter tuning, and evaluation. Finally, we’ll test our model on live data and backtest the predictions using vectorbt to gauge its potential profitability.
By following this tutorial, you’ll gain a deeper understanding of the application of machine learning techniques in the field of cryptocurrency trading and learn how to leverage the power of Random Forest for predicting market movements. Whether you’re an experienced trader or a machine learning enthusiast, this article will provide valuable insights and practical guidance to help you build your own trading strategies.
Importing Libraries and Data
First, let’s import the necessary libraries and set up the API connection.
import pandas as pd
import pandas_ta as ta
import numpy as np
import vectorbt as vbt
import yfinance as yf
from datetime import datetime
import matplotlib.pyplot as plt
import pydot
import vectorbt as vbt
import ccxt
initial ccxt and symbol
exchange = ccxt.binance()
symbol = 'ETH/USDT'
timeframe = '4h'
Fetching Historical Data
We’ll fetch historical OHLCV data from the Binance exchange starting from 2015.
# get OHLCV 4h.  focus on bear market 2018 , 2022 i want to create some stretegies to protect my wealth when bear market coming
from_ts = exchange.parse8601('2015-11-01 00:00:00')
ohlcv_list = []
ohlcv = exchange.fetch_ohlcv(symbol, timeframe, since=from_ts, limit=1000)
ohlcv_list.append(ohlcv)
while True:
    from_ts = ohlcv[-1][0]
    new_ohlcv = exchange.fetch_ohlcv(symbol, timeframe, since=from_ts, limit=1000)
    ohlcv.extend(new_ohlcv)
    if len(new_ohlcv)!=1000:
    	break
ohlcv_list
[[[1502942400000, 301.13, 307.96, 298.0, 307.96, 1561.95305],
[1502956800000, 307.95, 312.0, 307.0, 308.95, 1177.71088],
[1502971200000, 308.95, 310.51, 303.56, 307.06, 1882.05267],
...
[1517284800000, 1137.96, 1178.92, 1130.08, 1174.96, 14730.37261],
[1517299200000, 1174.05, 1186.85, 1156.0, 1169.89, 12918.61121],
[1517313600000, 1167.16, 1175.0, 1101.0, 1112.09, 26607.01368],
[1517328000000, 1112.5, 1133.01, 1051.0, 1112.11, 51675.82377],
...]]Next, we’ll create a DataFrame with the fetched data.
ohlcv_list = [[item[0], item[1], item[2], item[3], item[4], item[5]] for item in ohlcv_list[0]]

# create a DataFrame from the  list OHLCV from  2021-11-01 to 2023-03-16
df = pd.DataFrame(ohlcv_list, columns=['timestamp', 'open', 'high', 'low', 'close', 'volume'])

df
we will see dataframe like this
| timestamp | open | high | low | close | volume | |
|---|---|---|---|---|---|---|
| 0 | 1502942400000 | 301.13 | 307.96 | 298.00 | 307.96 | 1561.95305 |
| 1 | 1502956800000 | 307.95 | 312.00 | 307.00 | 308.95 | 1177.71088 |
| 2 | 1502971200000 | 308.95 | 310.51 | 303.56 | 307.06 | 1882.05267 |
| 3 | 1502985600000 | 307.74 | 312.18 | 298.21 | 301.60 | 1208.05192 |
| 4 | 1503000000000 | 301.60 | 310.85 | 299.01 | 302.00 | 1200.94182 |
| … | … | … | … | … | … | … |
| 12220 | 1678968000000 | 1660.37 | 1666.73 | 1635.96 | 1663.06 | 129192.79690 |
| 12221 | 1678982400000 | 1663.06 | 1691.42 | 1652.88 | 1679.64 | 113369.52090 |
| 12222 | 1678996800000 | 1679.64 | 1681.78 | 1652.53 | 1673.73 | 76922.01860 |
| 12223 | 1679011200000 | 1673.73 | 1725.00 | 1662.65 | 1708.62 | 166034.43070 |
| 12224 | 1679025600000 | 1708.62 | 1730.99 | 1696.37 | 1715.56 | 103495.68750 |
12225 rows × 6 columns
Preparing the Data
Now, we’ll prepare the data by adding timestamps and various technical indicators.
Add timestamp and set index
df_action=df.copy()
df_action['timestamp'] = pd.to_datetime(df['timestamp'], unit='ms')
df_action.reset_index(inplace=True)
df_action.set_index(df_action['timestamp'],inplace=True)
df_action| index | timestamp | open | high | low | close | volume | |
|---|---|---|---|---|---|---|---|
| timestamp | |||||||
| 2017-08-17 04:00:00 | 0 | 2017-08-17 04:00:00 | 301.13 | 307.96 | 298.00 | 307.96 | 1561.95305 |
| 2017-08-17 08:00:00 | 1 | 2017-08-17 08:00:00 | 307.95 | 312.00 | 307.00 | 308.95 | 1177.71088 |
| 2017-08-17 12:00:00 | 2 | 2017-08-17 12:00:00 | 308.95 | 310.51 | 303.56 | 307.06 | 1882.05267 |
| 2017-08-17 16:00:00 | 3 | 2017-08-17 16:00:00 | 307.74 | 312.18 | 298.21 | 301.60 | 1208.05192 |
| 2017-08-17 20:00:00 | 4 | 2017-08-17 20:00:00 | 301.60 | 310.85 | 299.01 | 302.00 | 1200.94182 |
| … | … | … | … | … | … | … | … |
| 2023-03-16 12:00:00 | 12220 | 2023-03-16 12:00:00 | 1660.37 | 1666.73 | 1635.96 | 1663.06 | 129192.79690 |
| 2023-03-16 16:00:00 | 12221 | 2023-03-16 16:00:00 | 1663.06 | 1691.42 | 1652.88 | 1679.64 | 113369.52090 |
| 2023-03-16 20:00:00 | 12222 | 2023-03-16 20:00:00 | 1679.64 | 1681.78 | 1652.53 | 1673.73 | 76922.01860 |
| 2023-03-17 00:00:00 | 12223 | 2023-03-17 00:00:00 | 1673.73 | 1725.00 | 1662.65 | 1708.62 | 166034.43070 |
| 2023-03-17 04:00:00 | 12224 | 2023-03-17 04:00:00 | 1708.62 | 1730.99 | 1696.37 | 1715.56 | 103495.68750 |
12225 rows × 7 columns
add MACD indicator
df_action.ta.macd(append=True)
df_action| index | timestamp | open | high | low | close | volume | MACD_12_26_9 | MACDh_12_26_9 | MACDs_12_26_9 | |
|---|---|---|---|---|---|---|---|---|---|---|
| timestamp | ||||||||||
| 2017-08-17 04:00:00 | 0 | 2017-08-17 04:00:00 | 301.13 | 307.96 | 298.00 | 307.96 | 1561.95305 | NaN | NaN | NaN |
| 2017-08-17 08:00:00 | 1 | 2017-08-17 08:00:00 | 307.95 | 312.00 | 307.00 | 308.95 | 1177.71088 | NaN | NaN | NaN |
| 2017-08-17 12:00:00 | 2 | 2017-08-17 12:00:00 | 308.95 | 310.51 | 303.56 | 307.06 | 1882.05267 | NaN | NaN | NaN |
| 2017-08-17 16:00:00 | 3 | 2017-08-17 16:00:00 | 307.74 | 312.18 | 298.21 | 301.60 | 1208.05192 | NaN | NaN | NaN |
| 2017-08-17 20:00:00 | 4 | 2017-08-17 20:00:00 | 301.60 | 310.85 | 299.01 | 302.00 | 1200.94182 | NaN | NaN | NaN |
| … | … | … | … | … | … | … | … | … | … | … |
| 2023-03-16 12:00:00 | 12220 | 2023-03-16 12:00:00 | 1660.37 | 1666.73 | 1635.96 | 1663.06 | 129192.79690 | 26.487664 | -9.729147 | 36.216810 |
| 2023-03-16 16:00:00 | 12221 | 2023-03-16 16:00:00 | 1663.06 | 1691.42 | 1652.88 | 1679.64 | 113369.52090 | 26.074843 | -8.113574 | 34.188417 |
| 2023-03-16 20:00:00 | 12222 | 2023-03-16 20:00:00 | 1679.64 | 1681.78 | 1652.53 | 1673.73 | 76922.01860 | 24.982806 | -7.364488 | 32.347295 |
| 2023-03-17 00:00:00 | 12223 | 2023-03-17 00:00:00 | 1673.73 | 1725.00 | 1662.65 | 1708.62 | 166034.43070 | 26.625765 | -4.577224 | 31.202989 |
| 2023-03-17 04:00:00 | 12224 | 2023-03-17 04:00:00 | 1708.62 | 1730.99 | 1696.37 | 1715.56 | 103495.68750 | 28.163175 | -2.431851 | 30.595026 |
12225 rows × 10 columns
create MACD trend when MACD line > MACD signals line
df_action['macd_trend']= df_action.MACD_12_26_9 > df_action.MACDs_12_26_9Add RSI indicator
df_action.ta.rsi(append=True)

 timestamp
    2017-08-17 04:00:00          NaN
    2017-08-17 08:00:00          NaN
    2017-08-17 12:00:00          NaN
    2017-08-17 16:00:00          NaN
    2017-08-17 20:00:00          NaN
                             ...
    2023-03-16 12:00:00    56.716544
    2023-03-16 16:00:00    59.590967
    2023-03-16 20:00:00    58.109595
    2023-03-17 00:00:00    63.826631
    2023-03-17 04:00:00    64.854113
    Name: RSI_14, Length: 12225, dtype: float64
Add RSI labels to dataframe
RSI < 50 = -1 and other is 1
df_action.loc[df_action['RSI_14']>75,'overbought']= 1
df_action.loc[df_action['RSI_14']<30,'oversold']= 1
df_action.loc[df_action['RSI_14']>50,'RSI_trend']= 1
df_action.loc[df_action['RSI_14']<50,'RSI_trend']=-1
preview dataframe
df_action| index | timestamp | open | high | low | close | volume | MACD_12_26_9 | MACDh_12_26_9 | MACDs_12_26_9 | macd_trend | RSI_14 | overbought | oversold | RSI_trend | |
|---|---|---|---|---|---|---|---|---|---|---|---|---|---|---|---|
| timestamp | |||||||||||||||
| 2017-08-17 04:00:00 | 0 | 2017-08-17 04:00:00 | 301.13 | 307.96 | 298.00 | 307.96 | 1561.95305 | NaN | NaN | NaN | False | NaN | NaN | NaN | NaN |
| 2017-08-17 08:00:00 | 1 | 2017-08-17 08:00:00 | 307.95 | 312.00 | 307.00 | 308.95 | 1177.71088 | NaN | NaN | NaN | False | NaN | NaN | NaN | NaN |
| 2017-08-17 12:00:00 | 2 | 2017-08-17 12:00:00 | 308.95 | 310.51 | 303.56 | 307.06 | 1882.05267 | NaN | NaN | NaN | False | NaN | NaN | NaN | NaN |
| 2017-08-17 16:00:00 | 3 | 2017-08-17 16:00:00 | 307.74 | 312.18 | 298.21 | 301.60 | 1208.05192 | NaN | NaN | NaN | False | NaN | NaN | NaN | NaN |
| 2017-08-17 20:00:00 | 4 | 2017-08-17 20:00:00 | 301.60 | 310.85 | 299.01 | 302.00 | 1200.94182 | NaN | NaN | NaN | False | NaN | NaN | NaN | NaN |
| … | … | … | … | … | … | … | … | … | … | … | … | … | … | … | … |
| 2023-03-16 12:00:00 | 12220 | 2023-03-16 12:00:00 | 1660.37 | 1666.73 | 1635.96 | 1663.06 | 129192.79690 | 26.487664 | -9.729147 | 36.216810 | False | 56.716544 | NaN | NaN | 1.0 |
| 2023-03-16 16:00:00 | 12221 | 2023-03-16 16:00:00 | 1663.06 | 1691.42 | 1652.88 | 1679.64 | 113369.52090 | 26.074843 | -8.113574 | 34.188417 | False | 59.590967 | NaN | NaN | 1.0 |
| 2023-03-16 20:00:00 | 12222 | 2023-03-16 20:00:00 | 1679.64 | 1681.78 | 1652.53 | 1673.73 | 76922.01860 | 24.982806 | -7.364488 | 32.347295 | False | 58.109595 | NaN | NaN | 1.0 |
| 2023-03-17 00:00:00 | 12223 | 2023-03-17 00:00:00 | 1673.73 | 1725.00 | 1662.65 | 1708.62 | 166034.43070 | 26.625765 | -4.577224 | 31.202989 | False | 63.826631 | NaN | NaN | 1.0 |
| 2023-03-17 04:00:00 | 12224 | 2023-03-17 04:00:00 | 1708.62 | 1730.99 | 1696.37 | 1715.56 | 103495.68750 | 28.163175 | -2.431851 | 30.595026 | False | 64.854113 | NaN | NaN | 1.0 |
12225 rows × 15 columns
Creating the Machine Learning Model
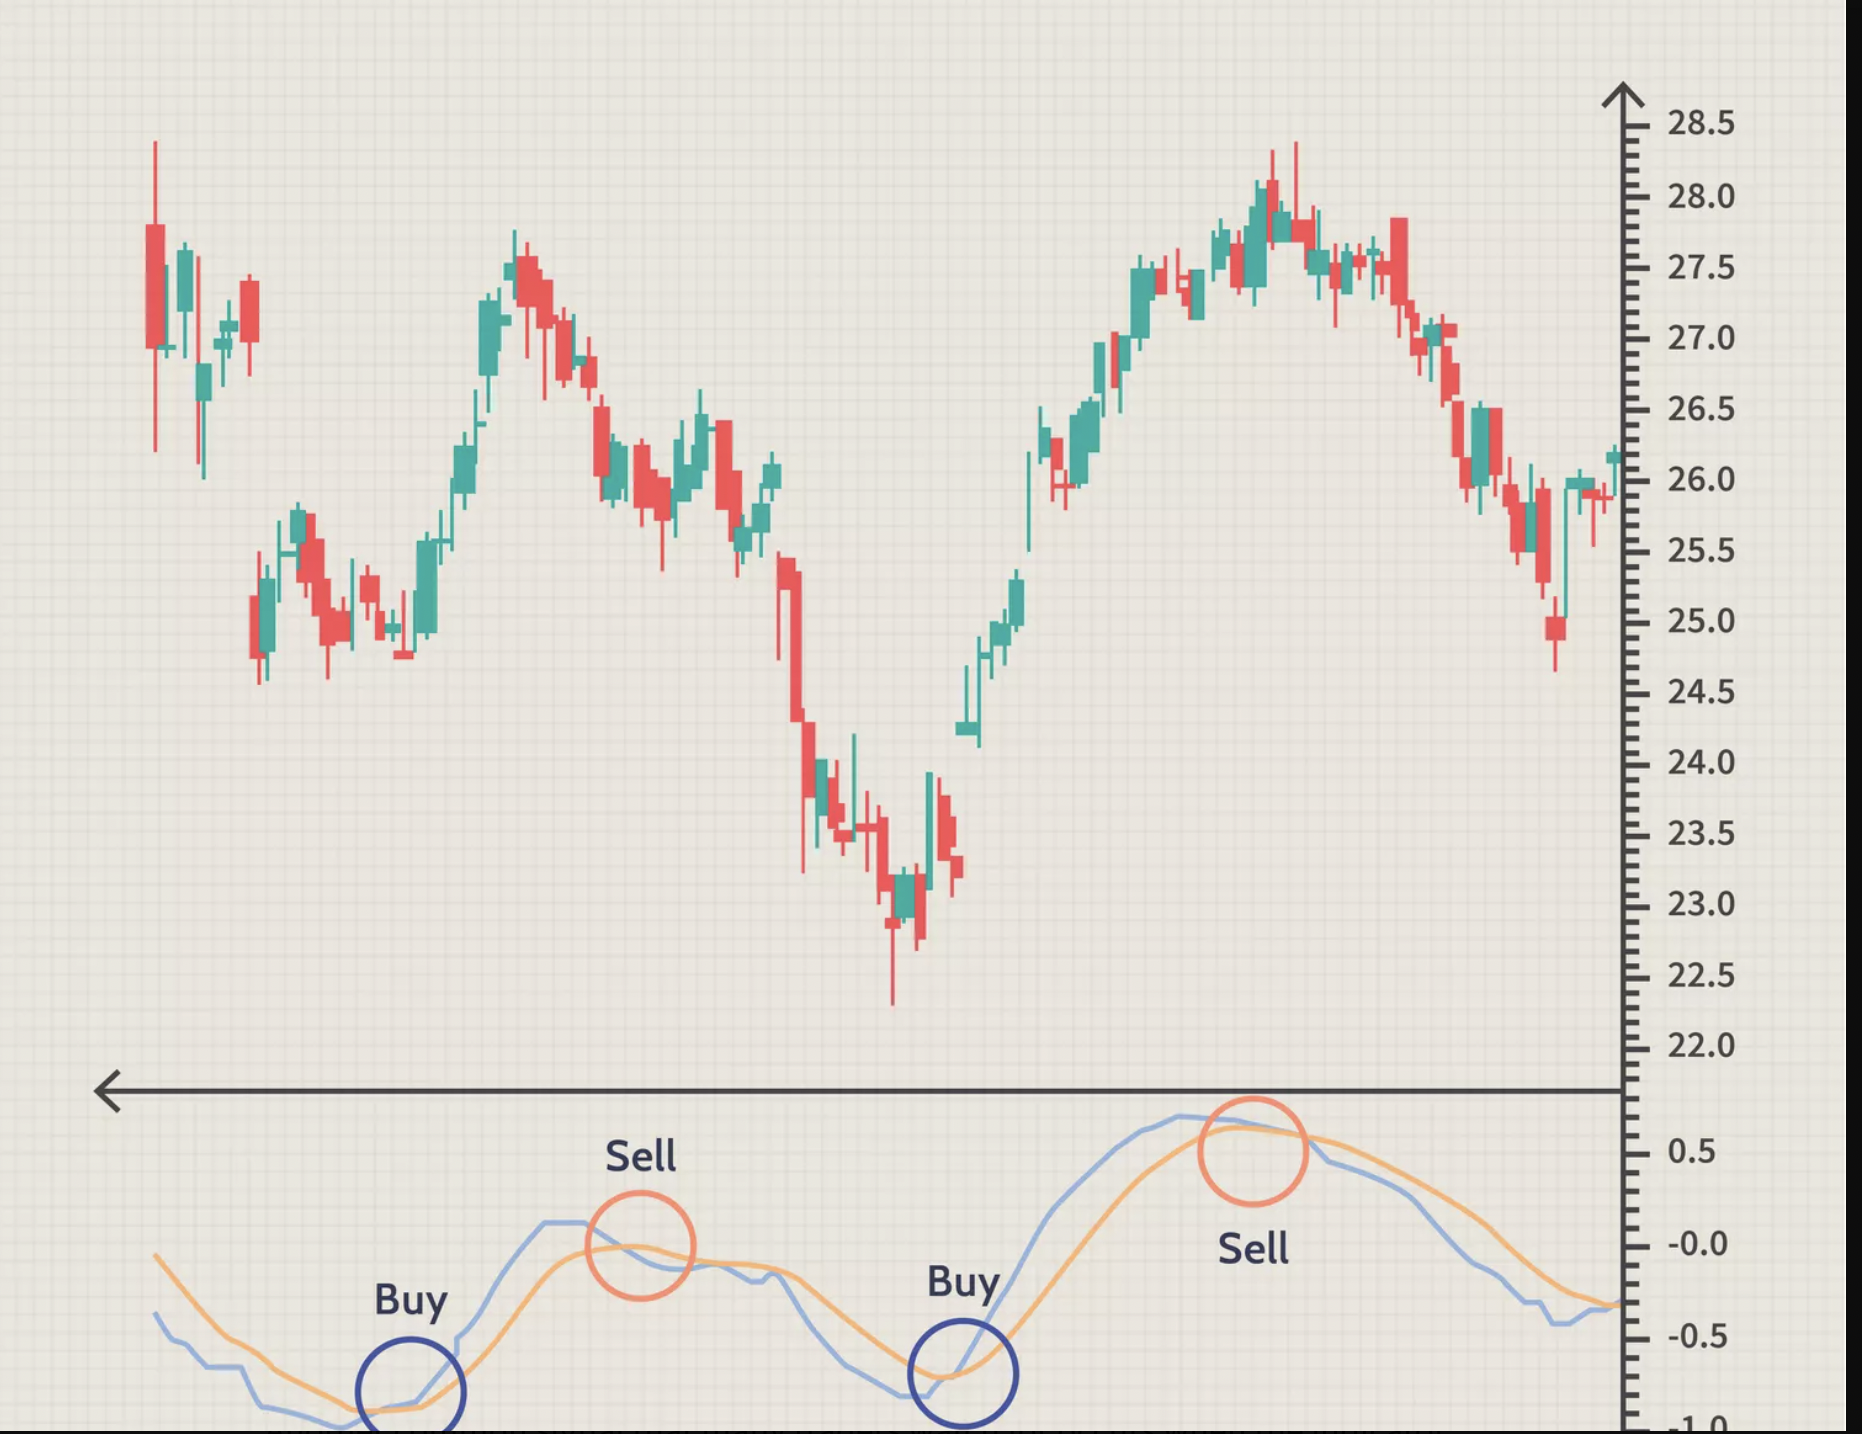
First, we’ll create signals based on the MACD trend. and check macd trend is shift and add iloc 2 cause want to shift fist signal shift macd at starts have noise to avoid that should shift
Next, we’ll create the Random Forest model, preprocess the data, and split it into training and testing sets.
signaled=df_action[df_action['macd_trend'].shift(1)!= df_action['macd_trend']].iloc[2:]
signaled| index | timestamp | open | high | low | close | volume | MACD_12_26_9 | MACDh_12_26_9 | MACDs_12_26_9 | macd_trend | RSI_14 | overbought | oversold | RSI_trend | |
|---|---|---|---|---|---|---|---|---|---|---|---|---|---|---|---|
| timestamp | |||||||||||||||
| 2017-08-26 00:00:00 | 53 | 2017-08-26 00:00:00 | 327.24 | 332.27 | 323.41 | 323.46 | 569.57801 | 5.218425 | -0.144303 | 5.362728 | False | 53.515087 | NaN | NaN | 1.0 |
| 2017-08-27 16:00:00 | 63 | 2017-08-27 16:00:00 | 335.04 | 341.47 | 332.97 | 339.64 | 795.13177 | 5.146901 | 0.285160 | 4.861741 | True | 68.589301 | NaN | NaN | 1.0 |
| 2017-08-31 16:00:00 | 87 | 2017-08-31 16:00:00 | 384.38 | 387.39 | 383.13 | 384.45 | 878.88372 | 12.619776 | -0.009218 | 12.628994 | False | 73.658395 | NaN | NaN | 1.0 |
| 2017-09-05 16:00:00 | 117 | 2017-09-05 16:00:00 | 290.07 | 321.52 | 285.94 | 318.26 | 677.80125 | -17.420385 | 0.985630 | -18.406015 | True | 48.964468 | NaN | NaN | -1.0 |
| 2017-09-08 12:00:00 | 134 | 2017-09-08 12:00:00 | 330.10 | 331.57 | 272.00 | 294.05 | 2343.12862 | -1.422169 | -0.756305 | -0.665864 | False | 36.802842 | NaN | NaN | -1.0 |
| … | … | … | … | … | … | … | … | … | … | … | … | … | … | … | … |
| 2023-03-03 00:00:00 | 12139 | 2023-03-03 00:00:00 | 1647.86 | 1649.25 | 1544.39 | 1565.44 | 317798.34160 | -2.231587 | -5.079240 | 2.847653 | False | 34.504987 | NaN | NaN | -1.0 |
| 2023-03-05 08:00:00 | 12153 | 2023-03-05 08:00:00 | 1568.61 | 1573.07 | 1564.03 | 1568.50 | 32527.56420 | -16.383615 | 0.212968 | -16.596583 | True | 38.888106 | NaN | NaN | -1.0 |
| 2023-03-08 20:00:00 | 12174 | 2023-03-08 20:00:00 | 1552.72 | 1561.29 | 1523.61 | 1532.38 | 128310.87040 | -9.161005 | -0.786086 | -8.374919 | False | 32.613518 | NaN | NaN | -1.0 |
| 2023-03-11 16:00:00 | 12191 | 2023-03-11 16:00:00 | 1428.00 | 1457.04 | 1422.32 | 1449.22 | 180365.58850 | -32.769032 | 1.859142 | -34.628174 | True | 42.608536 | NaN | NaN | -1.0 |
| 2023-03-15 12:00:00 | 12214 | 2023-03-15 12:00:00 | 1679.91 | 1698.29 | 1625.56 | 1634.04 | 313571.19570 | 46.865502 | -3.715414 | 50.580916 | False | 52.346900 | NaN | NaN | 1.0 |
921 rows × 15 columns
create return
signaled['return']=signaled['close'].pct_change().shift(-1)
signaled| index | timestamp | open | high | low | close | volume | MACD_12_26_9 | MACDh_12_26_9 | MACDs_12_26_9 | macd_trend | RSI_14 | overbought | oversold | RSI_trend | return | |
|---|---|---|---|---|---|---|---|---|---|---|---|---|---|---|---|---|
| timestamp | ||||||||||||||||
| 2017-08-26 00:00:00 | 53 | 2017-08-26 00:00:00 | 327.24 | 332.27 | 323.41 | 323.46 | 569.57801 | 5.218425 | -0.144303 | 5.362728 | False | 53.515087 | NaN | NaN | 1.0 | 0.050022 |
| 2017-08-27 16:00:00 | 63 | 2017-08-27 16:00:00 | 335.04 | 341.47 | 332.97 | 339.64 | 795.13177 | 5.146901 | 0.285160 | 4.861741 | True | 68.589301 | NaN | NaN | 1.0 | 0.131934 |
| 2017-08-31 16:00:00 | 87 | 2017-08-31 16:00:00 | 384.38 | 387.39 | 383.13 | 384.45 | 878.88372 | 12.619776 | -0.009218 | 12.628994 | False | 73.658395 | NaN | NaN | 1.0 | -0.172168 |
| 2017-09-05 16:00:00 | 117 | 2017-09-05 16:00:00 | 290.07 | 321.52 | 285.94 | 318.26 | 677.80125 | -17.420385 | 0.985630 | -18.406015 | True | 48.964468 | NaN | NaN | -1.0 | -0.076070 |
| 2017-09-08 12:00:00 | 134 | 2017-09-08 12:00:00 | 330.10 | 331.57 | 272.00 | 294.05 | 2343.12862 | -1.422169 | -0.756305 | -0.665864 | False | 36.802842 | NaN | NaN | -1.0 | 0.026220 |
| … | … | … | … | … | … | … | … | … | … | … | … | … | … | … | … | … |
| 2023-03-03 00:00:00 | 12139 | 2023-03-03 00:00:00 | 1647.86 | 1649.25 | 1544.39 | 1565.44 | 317798.34160 | -2.231587 | -5.079240 | 2.847653 | False | 34.504987 | NaN | NaN | -1.0 | 0.001955 |
| 2023-03-05 08:00:00 | 12153 | 2023-03-05 08:00:00 | 1568.61 | 1573.07 | 1564.03 | 1568.50 | 32527.56420 | -16.383615 | 0.212968 | -16.596583 | True | 38.888106 | NaN | NaN | -1.0 | -0.023028 |
| 2023-03-08 20:00:00 | 12174 | 2023-03-08 20:00:00 | 1552.72 | 1561.29 | 1523.61 | 1532.38 | 128310.87040 | -9.161005 | -0.786086 | -8.374919 | False | 32.613518 | NaN | NaN | -1.0 | -0.054269 |
| 2023-03-11 16:00:00 | 12191 | 2023-03-11 16:00:00 | 1428.00 | 1457.04 | 1422.32 | 1449.22 | 180365.58850 | -32.769032 | 1.859142 | -34.628174 | True | 42.608536 | NaN | NaN | -1.0 | 0.127531 |
| 2023-03-15 12:00:00 | 12214 | 2023-03-15 12:00:00 | 1679.91 | 1698.29 | 1625.56 | 1634.04 | 313571.19570 | 46.865502 | -3.715414 | 50.580916 | False | 52.346900 | NaN | NaN | 1.0 | NaN |
921 rows × 16 columns
Clean data
signaled=signaled.iloc[:-1]
signaled| index | timestamp | open | high | low | close | volume | MACD_12_26_9 | MACDh_12_26_9 | MACDs_12_26_9 | macd_trend | RSI_14 | overbought | oversold | RSI_trend | return | |
|---|---|---|---|---|---|---|---|---|---|---|---|---|---|---|---|---|
| timestamp | ||||||||||||||||
| 2017-08-26 00:00:00 | 53 | 2017-08-26 00:00:00 | 327.24 | 332.27 | 323.41 | 323.46 | 569.57801 | 5.218425 | -0.144303 | 5.362728 | False | 53.515087 | NaN | NaN | 1.0 | 0.050022 |
| 2017-08-27 16:00:00 | 63 | 2017-08-27 16:00:00 | 335.04 | 341.47 | 332.97 | 339.64 | 795.13177 | 5.146901 | 0.285160 | 4.861741 | True | 68.589301 | NaN | NaN | 1.0 | 0.131934 |
| 2017-08-31 16:00:00 | 87 | 2017-08-31 16:00:00 | 384.38 | 387.39 | 383.13 | 384.45 | 878.88372 | 12.619776 | -0.009218 | 12.628994 | False | 73.658395 | NaN | NaN | 1.0 | -0.172168 |
| 2017-09-05 16:00:00 | 117 | 2017-09-05 16:00:00 | 290.07 | 321.52 | 285.94 | 318.26 | 677.80125 | -17.420385 | 0.985630 | -18.406015 | True | 48.964468 | NaN | NaN | -1.0 | -0.076070 |
| 2017-09-08 12:00:00 | 134 | 2017-09-08 12:00:00 | 330.10 | 331.57 | 272.00 | 294.05 | 2343.12862 | -1.422169 | -0.756305 | -0.665864 | False | 36.802842 | NaN | NaN | -1.0 | 0.026220 |
| … | … | … | … | … | … | … | … | … | … | … | … | … | … | … | … | … |
| 2023-03-02 16:00:00 | 12137 | 2023-03-02 16:00:00 | 1628.31 | 1652.48 | 1621.45 | 1648.48 | 78007.64970 | 4.138191 | 0.061488 | 4.076702 | True | 53.188566 | NaN | NaN | 1.0 | -0.050374 |
| 2023-03-03 00:00:00 | 12139 | 2023-03-03 00:00:00 | 1647.86 | 1649.25 | 1544.39 | 1565.44 | 317798.34160 | -2.231587 | -5.079240 | 2.847653 | False | 34.504987 | NaN | NaN | -1.0 | 0.001955 |
| 2023-03-05 08:00:00 | 12153 | 2023-03-05 08:00:00 | 1568.61 | 1573.07 | 1564.03 | 1568.50 | 32527.56420 | -16.383615 | 0.212968 | -16.596583 | True | 38.888106 | NaN | NaN | -1.0 | -0.023028 |
| 2023-03-08 20:00:00 | 12174 | 2023-03-08 20:00:00 | 1552.72 | 1561.29 | 1523.61 | 1532.38 | 128310.87040 | -9.161005 | -0.786086 | -8.374919 | False | 32.613518 | NaN | NaN | -1.0 | -0.054269 |
| 2023-03-11 16:00:00 | 12191 | 2023-03-11 16:00:00 | 1428.00 | 1457.04 | 1422.32 | 1449.22 | 180365.58850 | -32.769032 | 1.859142 | -34.628174 | True | 42.608536 | NaN | NaN | -1.0 | 0.127531 |
920 rows × 16 columns
signaled_filter=signaled[['close','macd_trend','overbought','oversold','RSI_trend','MACDs_12_26_9','MACD_12_26_9','RSI_14','return',]]Label y: profit = 1, loss = -1, and nonprofit = 0
signaled_filter.loc[signaled_filter['return']>0,'y']=1
signaled_filter.loc[signaled_filter['return']<0,'y']=-1
signaled_filter.loc[signaled_filter['return']==0,'y']=0
Clean data
signaled_filter = signaled_filter.fillna(0)
signaled_filter| close | macd_trend | overbought | oversold | RSI_trend | MACDs_12_26_9 | MACD_12_26_9 | RSI_14 | return | y | |
|---|---|---|---|---|---|---|---|---|---|---|
| timestamp | ||||||||||
| 2017-08-26 00:00:00 | 323.46 | False | 0.0 | 0.0 | 1.0 | 5.362728 | 5.218425 | 53.515087 | 0.050022 | 1.0 |
| 2017-08-27 16:00:00 | 339.64 | True | 0.0 | 0.0 | 1.0 | 4.861741 | 5.146901 | 68.589301 | 0.131934 | 1.0 |
| 2017-08-31 16:00:00 | 384.45 | False | 0.0 | 0.0 | 1.0 | 12.628994 | 12.619776 | 73.658395 | -0.172168 | -1.0 |
| 2017-09-05 16:00:00 | 318.26 | True | 0.0 | 0.0 | -1.0 | -18.406015 | -17.420385 | 48.964468 | -0.076070 | -1.0 |
| 2017-09-08 12:00:00 | 294.05 | False | 0.0 | 0.0 | -1.0 | -0.665864 | -1.422169 | 36.802842 | 0.026220 | 1.0 |
| … | … | … | … | … | … | … | … | … | … | … |
| 2023-03-02 16:00:00 | 1648.48 | True | 0.0 | 0.0 | 1.0 | 4.076702 | 4.138191 | 53.188566 | -0.050374 | -1.0 |
| 2023-03-03 00:00:00 | 1565.44 | False | 0.0 | 0.0 | -1.0 | 2.847653 | -2.231587 | 34.504987 | 0.001955 | 1.0 |
| 2023-03-05 08:00:00 | 1568.50 | True | 0.0 | 0.0 | -1.0 | -16.596583 | -16.383615 | 38.888106 | -0.023028 | -1.0 |
| 2023-03-08 20:00:00 | 1532.38 | False | 0.0 | 0.0 | -1.0 | -8.374919 | -9.161005 | 32.613518 | -0.054269 | -1.0 |
| 2023-03-11 16:00:00 | 1449.22 | True | 0.0 | 0.0 | -1.0 | -34.628174 | -32.769032 | 42.608536 | 0.127531 | 1.0 |
920 rows × 10 columns
Separate features and target
#my_features to traning = ['macd_trend','overbought','oversold','RSI_trend','MACDs_12_26_9','MACD_12_26_9','RSI_14']
X = signaled_filter.iloc[:,1:-2]
y = signaled_filter.iloc[:,-1]X| macd_trend | overbought | oversold | RSI_trend | MACDs_12_26_9 | MACD_12_26_9 | RSI_14 | |
|---|---|---|---|---|---|---|---|
| timestamp | |||||||
| 2017-08-26 00:00:00 | False | 0.0 | 0.0 | 1.0 | 5.362728 | 5.218425 | 53.515087 |
| 2017-08-27 16:00:00 | True | 0.0 | 0.0 | 1.0 | 4.861741 | 5.146901 | 68.589301 |
| 2017-08-31 16:00:00 | False | 0.0 | 0.0 | 1.0 | 12.628994 | 12.619776 | 73.658395 |
| 2017-09-05 16:00:00 | True | 0.0 | 0.0 | -1.0 | -18.406015 | -17.420385 | 48.964468 |
| 2017-09-08 12:00:00 | False | 0.0 | 0.0 | -1.0 | -0.665864 | -1.422169 | 36.802842 |
| … | … | … | … | … | … | … | … |
| 2023-03-02 16:00:00 | True | 0.0 | 0.0 | 1.0 | 4.076702 | 4.138191 | 53.188566 |
| 2023-03-03 00:00:00 | False | 0.0 | 0.0 | -1.0 | 2.847653 | -2.231587 | 34.504987 |
| 2023-03-05 08:00:00 | True | 0.0 | 0.0 | -1.0 | -16.596583 | -16.383615 | 38.888106 |
| 2023-03-08 20:00:00 | False | 0.0 | 0.0 | -1.0 | -8.374919 | -9.161005 | 32.613518 |
| 2023-03-11 16:00:00 | True | 0.0 | 0.0 | -1.0 | -34.628174 | -32.769032 | 42.608536 |
920 rows × 7 columns
Split data into training and testing sets
from 920 data will use data to traning 700 data and test 100 data and split data to test with machine learning model 120 data how it working
X_train = X.iloc[:700]
y_train = y.iloc[:700]
X_test = X.iloc[700:800]
y_test = y.iloc[700:800]
Now, let’s import the Random Forest model and evaluate its performance.
Import machine learning model RandomForestRegressor and GridSearchCV for finding best parameter of machine learning and
from sklearn.model_selection import train_test_split
from sklearn.ensemble import (RandomForestRegressor,
                              RandomForestClassifier)
from sklearn.metrics import (mean_squared_error,
                             r2_score,
                             mean_absolute_error,
                             mean_absolute_percentage_error,
                             accuracy_score,
                             precision_score,
                             recall_score,
                             f1_score)
from sklearn.model_selection import (GridSearchCV,
                                     TimeSeriesSplit)
Split data (75% for training, 25% for testing)
X_train, X_test, y_train, y_test = train_test_split(X, y, test_size=0.25, random_state=0, shuffle=False)Hyperparameter Tuning with GridSearchCV
First, we define the Random Forest parameters for tuning with GridSearchCV:
rf_params = {
            'n_estimators': [100,200,300],
            'max_depth': np.arange(3,6,1),
            'min_samples_leaf': [1,2,5,10],
            'bootstrap': [True, False],
            'max_features': [1, 2],
}
Next, we use TimeSeriesSplit to split the data and obtain the best parameters using GridSearchCV:
# initial TimeSeriesSplit  = 5 it mean split to 5
tscv = TimeSeriesSplit(n_splits = 5)

# use grid Search parameter
rf_regr = GridSearchCV(RandomForestClassifier(random_state=0), rf_params, cv=tscv, n_jobs=-1)
grid_result = rf_regr.fit(X_train, y_train)

# we will see the result in this section

print('Best Score: ', grid_result.best_score_)
print('Best Params: ', grid_result.best_params_)

Best Score:  0.5982758620689654
Best Params:  {'bootstrap': True, 'max_depth': 3, 'max_features': 2, 'min_samples_leaf': 2, 'n_estimators': 100}
Creating the RandomForestClassifier
After obtaining the best parameters from GridSearchCV, we create the RandomForestClassifier:
clf =RandomForestClassifier(
    max_depth=grid_result.best_params_['max_depth'],
    n_estimators=grid_result.best_params_['n_estimators'],
    max_features=grid_result.best_params_['max_features'],
    min_samples_leaf=grid_result.best_params_['min_samples_leaf'],
    random_state=0)
clf.fit(X_train,y_train)

# output
RandomForestClassifier(max_depth=3, max_features=2, min_samples_leaf=2,random_state=0)
Feature Importance Analysis
We visualize the feature importance to understand the impact of each feature on the model:
Importance = pd.DataFrame({'feature importance':clf.feature_importances_*100}, index=X_train.columns)
Importance.sort_values('feature importance', axis=0, ascending=True).plot(kind='barh', color='r')
plt.xlabel('feature importance')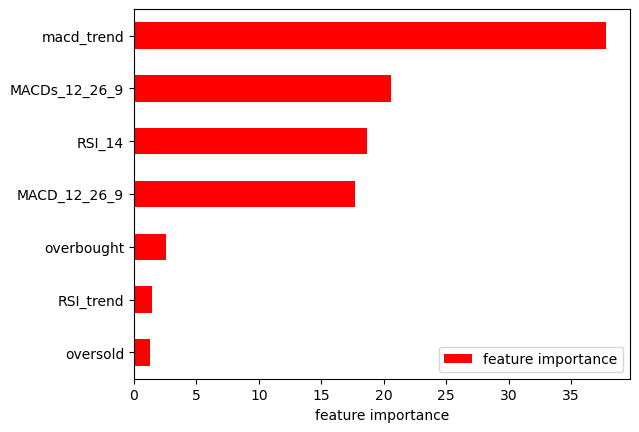
preview predict and actual with dataframe
y_pred = clf.predict(X_test)pd.DataFrame({'actual': y_test,
'predict': y_pred})| actual | predict | |
|---|---|---|
| timestamp | ||
| 2021-11-04 08:00:00 | 1.0 | 1.0 |
| 2021-11-07 08:00:00 | 1.0 | -1.0 |
| 2021-11-09 20:00:00 | -1.0 | 1.0 |
| 2021-11-15 00:00:00 | -1.0 | -1.0 |
| 2021-11-15 20:00:00 | -1.0 | 1.0 |
| … | … | … |
| 2022-05-13 04:00:00 | -1.0 | -1.0 |
| 2022-05-18 12:00:00 | 1.0 | 1.0 |
| 2022-05-19 16:00:00 | -1.0 | -1.0 |
| 2022-05-21 00:00:00 | 1.0 | 1.0 |
| 2022-05-21 04:00:00 | 1.0 | -1.0 |
100 rows × 2 columns
Create Confusion Matrix to see how accuracy from this model
from sklearn.metrics import plot_confusion_matrix
plot_confusion_matrix(clf,X_test,y_test)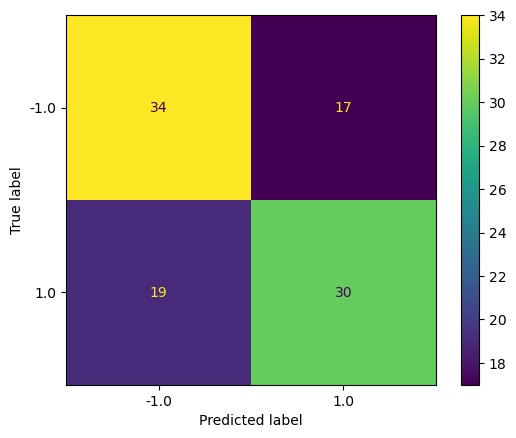
from sklearn import metricsModel Evaluation
We compare the predicted values with the actual values using a confusion matrix and calculate the accuracy, precision, recall, and F1 score:
print('Accuracy:',metrics.accuracy_score(y_test,y_pred))
print('Precision:',metrics.precision_score(y_test,y_pred))
print('Recall:',metrics.recall_score(y_test,y_pred))
print('F1 Score:',metrics.f1_score(y_test,y_pred))
    Accuracy: 0.64
    Precision: 0.6382978723404256
    Recall: 0.6122448979591837
    F1 Score: 0.625
test with real data
X_live = X.iloc[100:]
X_live| macd_trend | overbought | oversold | RSI_trend | MACDs_12_26_9 | MACD_12_26_9 | RSI_14 | |
|---|---|---|---|---|---|---|---|
| timestamp | |||||||
| 2018-04-22 00:00:00 | False | 0.0 | 0.0 | 1.0 | 23.126038 | 22.931511 | 62.966387 |
| 2018-04-22 08:00:00 | True | 0.0 | 0.0 | 1.0 | 23.071536 | 23.234708 | 69.677206 |
| 2018-04-23 08:00:00 | False | 0.0 | 0.0 | 1.0 | 23.713086 | 23.642522 | 66.992778 |
| 2018-04-24 00:00:00 | True | 0.0 | 0.0 | 1.0 | 23.458020 | 23.950860 | 72.530878 |
| 2018-04-25 04:00:00 | False | 0.0 | 0.0 | 1.0 | 27.296406 | 25.439792 | 56.633962 |
| … | … | … | … | … | … | … | … |
| 2023-03-02 16:00:00 | True | 0.0 | 0.0 | 1.0 | 4.076702 | 4.138191 | 53.188566 |
| 2023-03-03 00:00:00 | False | 0.0 | 0.0 | -1.0 | 2.847653 | -2.231587 | 34.504987 |
| 2023-03-05 08:00:00 | True | 0.0 | 0.0 | -1.0 | -16.596583 | -16.383615 | 38.888106 |
| 2023-03-08 20:00:00 | False | 0.0 | 0.0 | -1.0 | -8.374919 | -9.161005 | 32.613518 |
| 2023-03-11 16:00:00 | True | 0.0 | 0.0 | -1.0 | -34.628174 | -32.769032 | 42.608536 |
820 rows × 7 columns
test_live = signaled[100:].copy()
test_live| index | timestamp | open | high | low | close | volume | MACD_12_26_9 | MACDh_12_26_9 | MACDs_12_26_9 | macd_trend | RSI_14 | overbought | oversold | RSI_trend | return | |
|---|---|---|---|---|---|---|---|---|---|---|---|---|---|---|---|---|
| timestamp | ||||||||||||||||
| 2018-04-22 00:00:00 | 1481 | 2018-04-22 00:00:00 | 604.87 | 606.00 | 589.00 | 600.14 | 17037.36423 | 22.931511 | -0.194527 | 23.126038 | False | 62.966387 | NaN | NaN | 1.0 | 0.041657 |
| 2018-04-22 08:00:00 | 1483 | 2018-04-22 08:00:00 | 611.80 | 633.56 | 611.03 | 625.14 | 26165.67594 | 23.234708 | 0.163172 | 23.071536 | True | 69.677206 | NaN | NaN | 1.0 | 0.019548 |
| 2018-04-23 08:00:00 | 1489 | 2018-04-23 08:00:00 | 641.10 | 642.00 | 630.42 | 637.36 | 15391.27247 | 23.642522 | -0.070564 | 23.713086 | False | 66.992778 | NaN | NaN | 1.0 | 0.049752 |
| 2018-04-24 00:00:00 | 1493 | 2018-04-24 00:00:00 | 644.58 | 673.20 | 643.76 | 669.07 | 31087.69471 | 23.950860 | 0.492840 | 23.458020 | True | 72.530878 | NaN | NaN | 1.0 | -0.011763 |
| 2018-04-25 04:00:00 | 1500 | 2018-04-25 04:00:00 | 654.00 | 669.00 | 624.00 | 661.20 | 67160.89082 | 25.439792 | -1.856614 | 27.296406 | False | 56.633962 | NaN | NaN | 1.0 | 0.028947 |
| … | … | … | … | … | … | … | … | … | … | … | … | … | … | … | … | … |
| 2023-03-02 16:00:00 | 12137 | 2023-03-02 16:00:00 | 1628.31 | 1652.48 | 1621.45 | 1648.48 | 78007.64970 | 4.138191 | 0.061488 | 4.076702 | True | 53.188566 | NaN | NaN | 1.0 | -0.050374 |
| 2023-03-03 00:00:00 | 12139 | 2023-03-03 00:00:00 | 1647.86 | 1649.25 | 1544.39 | 1565.44 | 317798.34160 | -2.231587 | -5.079240 | 2.847653 | False | 34.504987 | NaN | NaN | -1.0 | 0.001955 |
| 2023-03-05 08:00:00 | 12153 | 2023-03-05 08:00:00 | 1568.61 | 1573.07 | 1564.03 | 1568.50 | 32527.56420 | -16.383615 | 0.212968 | -16.596583 | True | 38.888106 | NaN | NaN | -1.0 | -0.023028 |
| 2023-03-08 20:00:00 | 12174 | 2023-03-08 20:00:00 | 1552.72 | 1561.29 | 1523.61 | 1532.38 | 128310.87040 | -9.161005 | -0.786086 | -8.374919 | False | 32.613518 | NaN | NaN | -1.0 | -0.054269 |
| 2023-03-11 16:00:00 | 12191 | 2023-03-11 16:00:00 | 1428.00 | 1457.04 | 1422.32 | 1449.22 | 180365.58850 | -32.769032 | 1.859142 | -34.628174 | True | 42.608536 | NaN | NaN | -1.0 | 0.127531 |
820 rows × 16 columns
test_live['signal']=clf.predict(X_live)
test_live| index | timestamp | open | high | low | close | volume | MACD_12_26_9 | MACDh_12_26_9 | MACDs_12_26_9 | macd_trend | RSI_14 | overbought | oversold | RSI_trend | return | signal | |
|---|---|---|---|---|---|---|---|---|---|---|---|---|---|---|---|---|---|
| timestamp | |||||||||||||||||
| 2018-04-22 00:00:00 | 1481 | 2018-04-22 00:00:00 | 604.87 | 606.00 | 589.00 | 600.14 | 17037.36423 | 22.931511 | -0.194527 | 23.126038 | False | 62.966387 | NaN | NaN | 1.0 | 0.041657 | 1.0 |
| 2018-04-22 08:00:00 | 1483 | 2018-04-22 08:00:00 | 611.80 | 633.56 | 611.03 | 625.14 | 26165.67594 | 23.234708 | 0.163172 | 23.071536 | True | 69.677206 | NaN | NaN | 1.0 | 0.019548 | -1.0 |
| 2018-04-23 08:00:00 | 1489 | 2018-04-23 08:00:00 | 641.10 | 642.00 | 630.42 | 637.36 | 15391.27247 | 23.642522 | -0.070564 | 23.713086 | False | 66.992778 | NaN | NaN | 1.0 | 0.049752 | 1.0 |
| 2018-04-24 00:00:00 | 1493 | 2018-04-24 00:00:00 | 644.58 | 673.20 | 643.76 | 669.07 | 31087.69471 | 23.950860 | 0.492840 | 23.458020 | True | 72.530878 | NaN | NaN | 1.0 | -0.011763 | -1.0 |
| 2018-04-25 04:00:00 | 1500 | 2018-04-25 04:00:00 | 654.00 | 669.00 | 624.00 | 661.20 | 67160.89082 | 25.439792 | -1.856614 | 27.296406 | False | 56.633962 | NaN | NaN | 1.0 | 0.028947 | 1.0 |
| … | … | … | … | … | … | … | … | … | … | … | … | … | … | … | … | … | … |
| 2023-03-02 16:00:00 | 12137 | 2023-03-02 16:00:00 | 1628.31 | 1652.48 | 1621.45 | 1648.48 | 78007.64970 | 4.138191 | 0.061488 | 4.076702 | True | 53.188566 | NaN | NaN | 1.0 | -0.050374 | -1.0 |
| 2023-03-03 00:00:00 | 12139 | 2023-03-03 00:00:00 | 1647.86 | 1649.25 | 1544.39 | 1565.44 | 317798.34160 | -2.231587 | -5.079240 | 2.847653 | False | 34.504987 | NaN | NaN | -1.0 | 0.001955 | 1.0 |
| 2023-03-05 08:00:00 | 12153 | 2023-03-05 08:00:00 | 1568.61 | 1573.07 | 1564.03 | 1568.50 | 32527.56420 | -16.383615 | 0.212968 | -16.596583 | True | 38.888106 | NaN | NaN | -1.0 | -0.023028 | -1.0 |
| 2023-03-08 20:00:00 | 12174 | 2023-03-08 20:00:00 | 1552.72 | 1561.29 | 1523.61 | 1532.38 | 128310.87040 | -9.161005 | -0.786086 | -8.374919 | False | 32.613518 | NaN | NaN | -1.0 | -0.054269 | 1.0 |
| 2023-03-11 16:00:00 | 12191 | 2023-03-11 16:00:00 | 1428.00 | 1457.04 | 1422.32 | 1449.22 | 180365.58850 | -32.769032 | 1.859142 | -34.628174 | True | 42.608536 | NaN | NaN | -1.0 | 0.127531 | -1.0 |
820 rows × 17 columns
change signal ml from -1 1. to True False cause will use to vectorbt backtest
test_live['signal']=test_live['signal'].apply(lambda x:True if x==1 else False)
test_live
| index | timestamp | open | high | low | close | volume | MACD_12_26_9 | MACDh_12_26_9 | MACDs_12_26_9 | macd_trend | RSI_14 | overbought | oversold | RSI_trend | return | signal | |
|---|---|---|---|---|---|---|---|---|---|---|---|---|---|---|---|---|---|
| timestamp | |||||||||||||||||
| 2018-04-22 00:00:00 | 1481 | 2018-04-22 00:00:00 | 604.87 | 606.00 | 589.00 | 600.14 | 17037.36423 | 22.931511 | -0.194527 | 23.126038 | False | 62.966387 | NaN | NaN | 1.0 | 0.041657 | True |
| 2018-04-22 08:00:00 | 1483 | 2018-04-22 08:00:00 | 611.80 | 633.56 | 611.03 | 625.14 | 26165.67594 | 23.234708 | 0.163172 | 23.071536 | True | 69.677206 | NaN | NaN | 1.0 | 0.019548 | False |
| 2018-04-23 08:00:00 | 1489 | 2018-04-23 08:00:00 | 641.10 | 642.00 | 630.42 | 637.36 | 15391.27247 | 23.642522 | -0.070564 | 23.713086 | False | 66.992778 | NaN | NaN | 1.0 | 0.049752 | True |
| 2018-04-24 00:00:00 | 1493 | 2018-04-24 00:00:00 | 644.58 | 673.20 | 643.76 | 669.07 | 31087.69471 | 23.950860 | 0.492840 | 23.458020 | True | 72.530878 | NaN | NaN | 1.0 | -0.011763 | False |
| 2018-04-25 04:00:00 | 1500 | 2018-04-25 04:00:00 | 654.00 | 669.00 | 624.00 | 661.20 | 67160.89082 | 25.439792 | -1.856614 | 27.296406 | False | 56.633962 | NaN | NaN | 1.0 | 0.028947 | True |
| … | … | … | … | … | … | … | … | … | … | … | … | … | … | … | … | … | … |
| 2023-03-02 16:00:00 | 12137 | 2023-03-02 16:00:00 | 1628.31 | 1652.48 | 1621.45 | 1648.48 | 78007.64970 | 4.138191 | 0.061488 | 4.076702 | True | 53.188566 | NaN | NaN | 1.0 | -0.050374 | False |
| 2023-03-03 00:00:00 | 12139 | 2023-03-03 00:00:00 | 1647.86 | 1649.25 | 1544.39 | 1565.44 | 317798.34160 | -2.231587 | -5.079240 | 2.847653 | False | 34.504987 | NaN | NaN | -1.0 | 0.001955 | True |
| 2023-03-05 08:00:00 | 12153 | 2023-03-05 08:00:00 | 1568.61 | 1573.07 | 1564.03 | 1568.50 | 32527.56420 | -16.383615 | 0.212968 | -16.596583 | True | 38.888106 | NaN | NaN | -1.0 | -0.023028 | False |
| 2023-03-08 20:00:00 | 12174 | 2023-03-08 20:00:00 | 1552.72 | 1561.29 | 1523.61 | 1532.38 | 128310.87040 | -9.161005 | -0.786086 | -8.374919 | False | 32.613518 | NaN | NaN | -1.0 | -0.054269 | True |
| 2023-03-11 16:00:00 | 12191 | 2023-03-11 16:00:00 | 1428.00 | 1457.04 | 1422.32 | 1449.22 | 180365.58850 | -32.769032 | 1.859142 | -34.628174 | True | 42.608536 | NaN | NaN | -1.0 | 0.127531 | False |
820 rows × 17 columns
Testing the Model on Live Data
We test the model on live data to validate its performance and use vectorbt to backtest the results.
Filter the prediction data frame based on the live test data
time_predict =test_live.index[0]
df_predict=df.copy()df_predict['timestamp'] = pd.to_datetime(df['timestamp'], unit='ms')
df_predict.reset_index(inplace=True)
df_predict.set_index(df_predict['timestamp'],inplace=True)
df_predict| index | timestamp | open | high | low | close | volume | |
|---|---|---|---|---|---|---|---|
| timestamp | |||||||
| 2017-08-17 04:00:00 | 0 | 2017-08-17 04:00:00 | 301.13 | 307.96 | 298.00 | 307.96 | 1561.95305 |
| 2017-08-17 08:00:00 | 1 | 2017-08-17 08:00:00 | 307.95 | 312.00 | 307.00 | 308.95 | 1177.71088 |
| 2017-08-17 12:00:00 | 2 | 2017-08-17 12:00:00 | 308.95 | 310.51 | 303.56 | 307.06 | 1882.05267 |
| 2017-08-17 16:00:00 | 3 | 2017-08-17 16:00:00 | 307.74 | 312.18 | 298.21 | 301.60 | 1208.05192 |
| 2017-08-17 20:00:00 | 4 | 2017-08-17 20:00:00 | 301.60 | 310.85 | 299.01 | 302.00 | 1200.94182 |
| … | … | … | … | … | … | … | … |
| 2023-03-16 12:00:00 | 12220 | 2023-03-16 12:00:00 | 1660.37 | 1666.73 | 1635.96 | 1663.06 | 129192.79690 |
| 2023-03-16 16:00:00 | 12221 | 2023-03-16 16:00:00 | 1663.06 | 1691.42 | 1652.88 | 1679.64 | 113369.52090 |
| 2023-03-16 20:00:00 | 12222 | 2023-03-16 20:00:00 | 1679.64 | 1681.78 | 1652.53 | 1673.73 | 76922.01860 |
| 2023-03-17 00:00:00 | 12223 | 2023-03-17 00:00:00 | 1673.73 | 1725.00 | 1662.65 | 1708.62 | 166034.43070 |
| 2023-03-17 04:00:00 | 12224 | 2023-03-17 04:00:00 | 1708.62 | 1730.99 | 1696.37 | 1715.56 | 103495.68750 |
12225 rows × 7 columns
df_predict=df_predict.loc[time_predict:,:'close']
df_predict| index | timestamp | open | high | low | close | |
|---|---|---|---|---|---|---|
| timestamp | ||||||
| 2018-04-22 00:00:00 | 1481 | 2018-04-22 00:00:00 | 604.87 | 606.00 | 589.00 | 600.14 |
| 2018-04-22 04:00:00 | 1482 | 2018-04-22 04:00:00 | 600.22 | 612.49 | 599.00 | 611.80 |
| 2018-04-22 08:00:00 | 1483 | 2018-04-22 08:00:00 | 611.80 | 633.56 | 611.03 | 625.14 |
| 2018-04-22 12:00:00 | 1484 | 2018-04-22 12:00:00 | 625.20 | 641.00 | 614.31 | 634.46 |
| 2018-04-22 16:00:00 | 1485 | 2018-04-22 16:00:00 | 634.46 | 643.49 | 630.00 | 636.58 |
| … | … | … | … | … | … | … |
| 2023-03-16 12:00:00 | 12220 | 2023-03-16 12:00:00 | 1660.37 | 1666.73 | 1635.96 | 1663.06 |
| 2023-03-16 16:00:00 | 12221 | 2023-03-16 16:00:00 | 1663.06 | 1691.42 | 1652.88 | 1679.64 |
| 2023-03-16 20:00:00 | 12222 | 2023-03-16 20:00:00 | 1679.64 | 1681.78 | 1652.53 | 1673.73 |
| 2023-03-17 00:00:00 | 12223 | 2023-03-17 00:00:00 | 1673.73 | 1725.00 | 1662.65 | 1708.62 |
| 2023-03-17 04:00:00 | 12224 | 2023-03-17 04:00:00 | 1708.62 | 1730.99 | 1696.37 | 1715.56 |
10744 rows × 6 columns
test_live['signal']

timestamp
    2018-04-22 00:00:00     True
    2018-04-22 08:00:00    False
    2018-04-23 08:00:00     True
    2018-04-24 00:00:00    False
    2018-04-25 04:00:00     True
                           ...
    2023-03-02 16:00:00    False
    2023-03-03 00:00:00     True
    2023-03-05 08:00:00    False
    2023-03-08 20:00:00     True
    2023-03-11 16:00:00    False
    Name: signal, Length: 820, dtype: bool
Add the signal from the machine learning model to the live data
df_predict =  df_predict.join(test_live['signal'])
df_predict =df_predict.fillna(method='ffill')df_predict| index | timestamp | open | high | low | close | signal | |
|---|---|---|---|---|---|---|---|
| timestamp | |||||||
| 2018-04-22 00:00:00 | 1481 | 2018-04-22 00:00:00 | 604.87 | 606.00 | 589.00 | 600.14 | True |
| 2018-04-22 04:00:00 | 1482 | 2018-04-22 04:00:00 | 600.22 | 612.49 | 599.00 | 611.80 | True |
| 2018-04-22 08:00:00 | 1483 | 2018-04-22 08:00:00 | 611.80 | 633.56 | 611.03 | 625.14 | False |
| 2018-04-22 12:00:00 | 1484 | 2018-04-22 12:00:00 | 625.20 | 641.00 | 614.31 | 634.46 | False |
| 2018-04-22 16:00:00 | 1485 | 2018-04-22 16:00:00 | 634.46 | 643.49 | 630.00 | 636.58 | False |
| … | … | … | … | … | … | … | … |
| 2023-03-16 12:00:00 | 12220 | 2023-03-16 12:00:00 | 1660.37 | 1666.73 | 1635.96 | 1663.06 | False |
| 2023-03-16 16:00:00 | 12221 | 2023-03-16 16:00:00 | 1663.06 | 1691.42 | 1652.88 | 1679.64 | False |
| 2023-03-16 20:00:00 | 12222 | 2023-03-16 20:00:00 | 1679.64 | 1681.78 | 1652.53 | 1673.73 | False |
| 2023-03-17 00:00:00 | 12223 | 2023-03-17 00:00:00 | 1673.73 | 1725.00 | 1662.65 | 1708.62 | False |
| 2023-03-17 04:00:00 | 12224 | 2023-03-17 04:00:00 | 1708.62 | 1730.99 | 1696.37 | 1715.56 | False |
10744 rows × 7 columns
Create vectorbt signals
signal_vectorbt_ml_turning = df_predict.ta.tsignals(df_predict.signal,
                                           asbool=True,append=True)

signal_vectorbt_ml_turning.loc[signal_vectorbt_ml_turning['TS_Trades']!=0]
will see the result vectorbt signal
| TS_Trends | TS_Trades | TS_Entries | TS_Exits | |
|---|---|---|---|---|
| timestamp | ||||
| 2018-04-22 08:00:00 | False | -1 | False | True |
| 2018-04-23 08:00:00 | True | 1 | True | False |
| 2018-04-24 00:00:00 | False | -1 | False | True |
| 2018-04-25 04:00:00 | True | 1 | True | False |
| 2018-04-27 08:00:00 | False | -1 | False | True |
| … | … | … | … | … |
| 2023-03-02 16:00:00 | False | -1 | False | True |
| 2023-03-03 00:00:00 | True | 1 | True | False |
| 2023-03-05 08:00:00 | False | -1 | False | True |
| 2023-03-08 20:00:00 | True | 1 | True | False |
| 2023-03-11 16:00:00 | False | -1 | False | True |
783 rows × 4 columns
Use vectorbt Portfolio from_signals to backtest the strategy
port_ml_turning = vbt.Portfolio.from_signals(df_predict.open,entries=signal_vectorbt_ml_turning.TS_Exits,exits=signal_vectorbt_ml_turning.TS_Entries,freq = '4h',init_cash = 1000,size=0.1,fees = 0.0002,direction=2,slippage = 0.005,)

#Plot the portfolio

port_ml_turning.plot().show()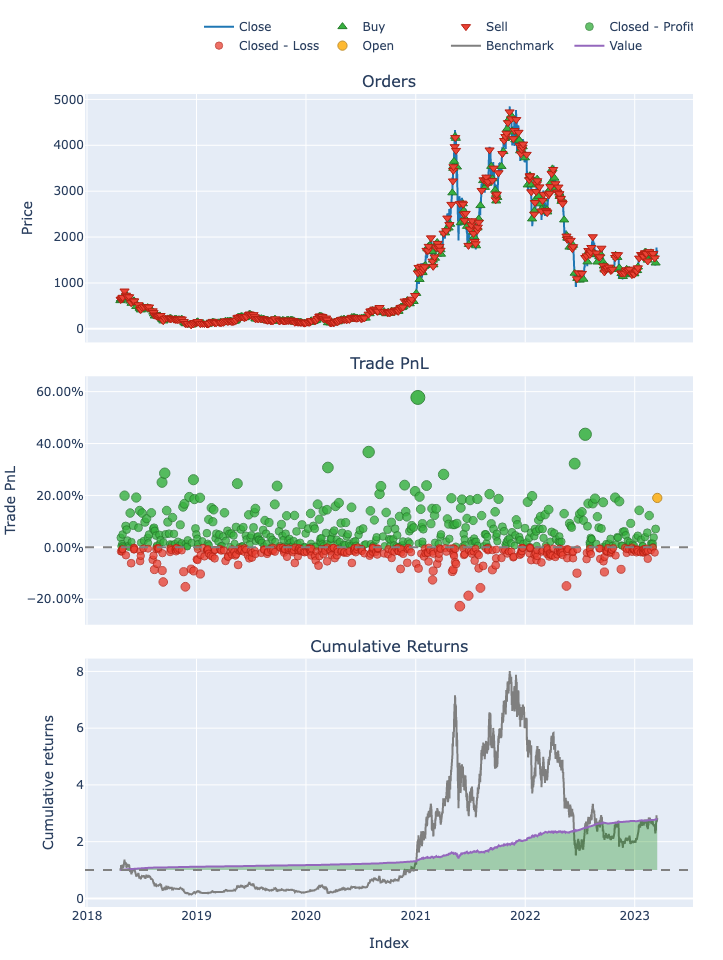
Display the portfolio statistics
port_ml_turning.stats()

    Start                               2018-04-22 00:00:00
    End                                 2023-03-17 04:00:00
    Period                                447 days 16:00:00
    Start Value                                      1000.0
    End Value                                   2802.131168
    Total Return [%]                             180.213117
    Benchmark Return [%]                         182.477227
    Max Gross Exposure [%]                        27.505487
    Total Fees Paid                               36.027332
    Max Drawdown [%]                              13.663183
    Max Drawdown Duration                  12 days 00:00:00
    Total Trades                                        783
    Total Closed Trades                                 782
    Total Open Trades                                     1
    Open Trade PnL                                27.319297
    Win Rate [%]                                  51.918159
    Best Trade [%]                                57.756017
    Worst Trade [%]                              -22.688176
    Avg Winning Trade [%]                          6.603421
    Avg Losing Trade [%]                          -2.416791
    Avg Winning Trade Duration    0 days 17:53:56.453201970
    Avg Losing Trade Duration     0 days 09:09:05.744680851
    Profit Factor                                  2.443637
    Expectancy                                      2.26958
    Sharpe Ratio                                   4.818487
    Calmar Ratio                                   9.636257
    Omega Ratio                                    1.234305
    Sortino Ratio                                  7.252599
    dtype: object