
What Idea about Correlation Currency ?
The idea of correlation-based currency pair trading is to analyze the correlation between different currency pairs and utilize this information to make informed trading decisions. By identifying currency pairs with positive correlation, we can implement pair trading strategies or predict the potential movement of one currency based on the performance of another. In this example, we will analyze the correlation between the following currency pairs:
| Currency Pair |
|---|
| EURUSD |
| GBPUSD |
| AUDUSD |
| NZDUSD |
| CADUSD |
| CHFUSD |
| FJDUSD |
| GHSUSD |
| JPYUSD |
| KYDUSD |
| SGDUSD |
| THBUSD |
| BYNUSD |
| MYRUSD |
| HUFUSD |
| ARSUSD |
Import the necessary libraries such as yfinance, pandas, numpy, matplotlib, and seaborn.
import yfinance as yf
import pandas as pd
import numpy as np
import matplotlib.pyplot as plt
import seaborn as sns
Download historical currency data from Yahoo Finance.
data = yf.download("EURUSD=X GBPUSD=X AUDUSD=X NZDUSD=X CADUSD=X CHFUSD=X FJDUSD=X GHSUSD=X JPYUSD=X KYDUSD=X SGDUSD=X THBUSD=X BYNUSD=X MYRUSD=X HUFUSD=X ARSUSD=X",start = '2021-01-01',end='2021-10-14',period='1d')df= data['Adj Close']df.head(2)
|  Date |  ARSUSD=X |  AUDUSD=X |  BYNUSD=X |  CADUSD=X |  CHFUSD=X |  EURUSD=X |  FJDUSD=X |  GBPUSD=X |  GHSUSD=X |  HUFUSD=X |  JPYUSD=X |  KYDUSD=X |  MYRUSD=X |  NZDUSD=X |  SGDUSD=X |  THBUSD=X |

| 2021-01-01  | 0.011895  | 0.770297  | 0.383408  | 0.809723  | 1.113462  | 1.218027  | 0.490196  | 1.367301  | 0.171233  | 0.003370  | 0.009687  | 1.224190  | 0.248756  | 0.718200  | 0.756659  | 0.033444  |

| 2021-01-04  | 0.011869  | 0.771230  | 0.381441  | 0.786034  | 1.132375  | 1.225070  | 0.492902  | 1.368420  | 0.170109  | 0.003383  | 0.009686  | 1.217919  | 0.248756  | 0.719839  | 0.757191  | 0.033385  |
we will see dataframe like this
df.stack().groupby(level=1).head(1) Date
2021-01-01 ARSUSD=X 0.011895
AUDUSD=X 0.770297
BYNUSD=X 0.383408
CADUSD=X 0.809723
CHFUSD=X 1.113462
EURUSD=X 1.218027
FJDUSD=X 0.490196
GBPUSD=X 1.367301
GHSUSD=X 0.171233
HUFUSD=X 0.003370
JPYUSD=X 0.009687
KYDUSD=X 1.224190
MYRUSD=X 0.248756
NZDUSD=X 0.718200
SGDUSD=X 0.756659
THBUSD=X 0.033444
dtype: float64Clean the data by filling missing values using the forward-fill method. Calculate the daily percentage returns for each currency pair.
df = df.fillna(method='ffill')
df_return = df.pct_change()
df_ret = df_return.loc[~df_return.isnull().sum(1).astype(bool)]
Create a correlation matrix using the percentage returns.
Visualize the correlation matrix using Seaborn’s clustermap function to identify groups of correlated currency pairs.
g = sns.clustermap(df_ret.corr(), method='ward', center = 0.0, cmap="RdYlGn",
                   dendrogram_ratio=(.2, .2),
                   linewidths=.75, figsize=(12, 13),
                   annot = True)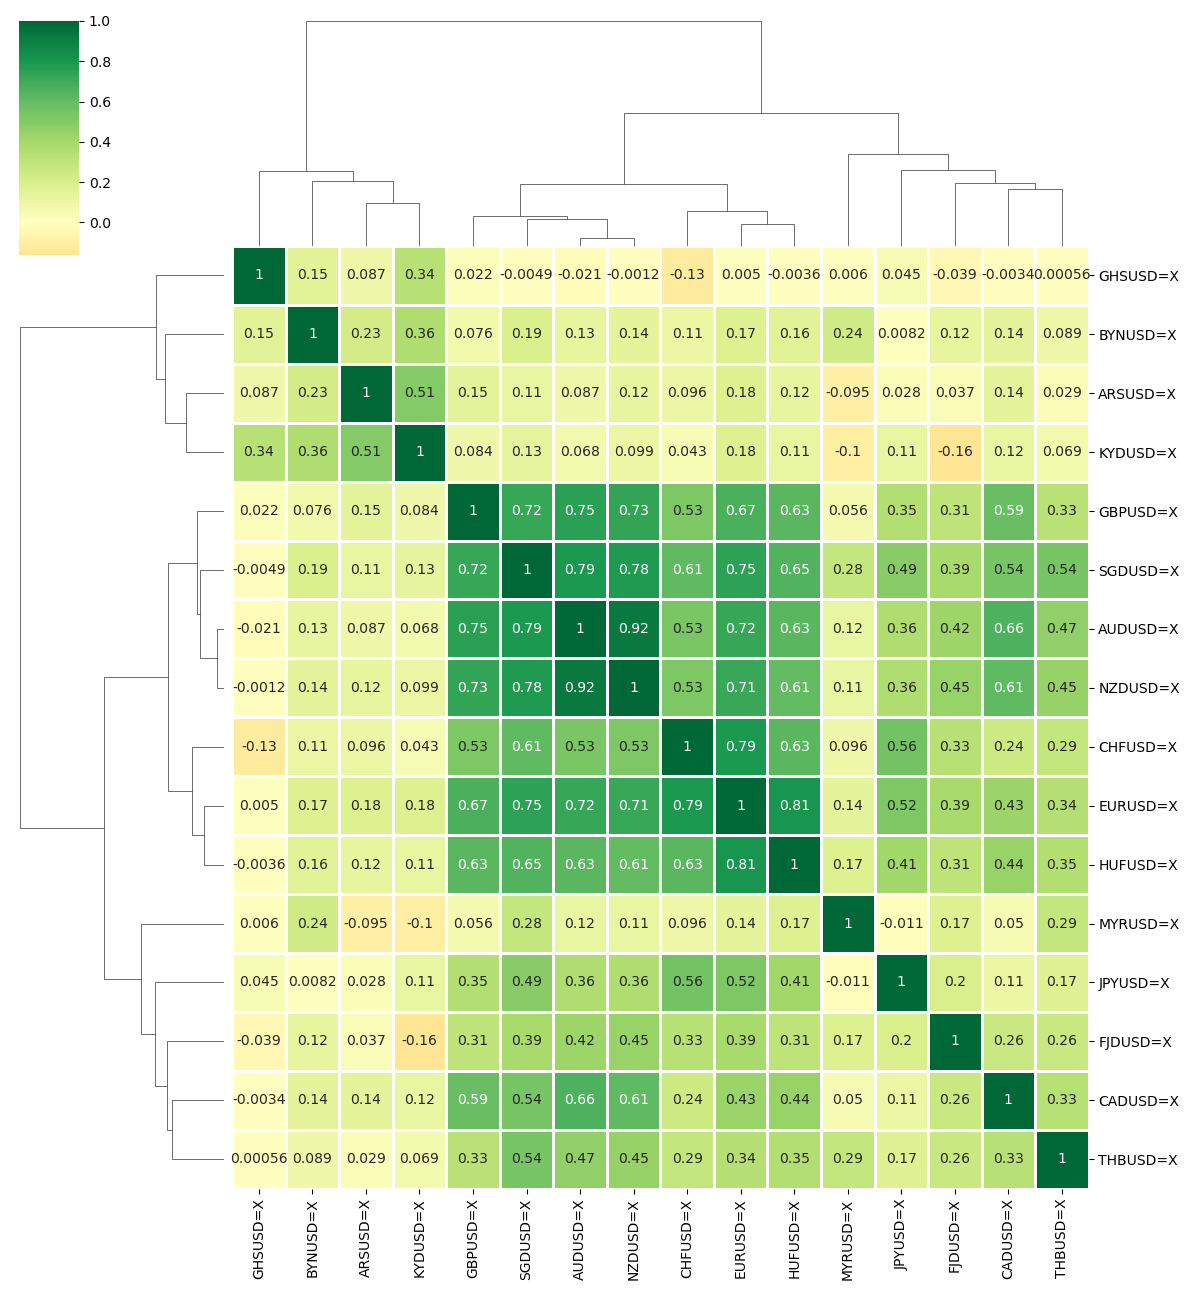
Based on the visualization, create two groups of correlated currency pairs:
Group 1: GBPUSD, SGDUSD, AUDUSD, NZDUSD
Group 2: CHFUSD, EURUSD, HUFUSD
Calculate the cumulative geometric returns for each group.
group1 = df[['GBPUSD=X', 'SGDUSD=X', 'AUDUSD=X', 'NZDUSD=X']]
group2 = df[['CHFUSD=X', 'EURUSD=X', 'HUFUSD=X']]
create return value of group1
group1_geo_ret = (group1.pct_change()+1).cumprod()
group1_geo_ret
| Date       | GBPUSD=X | SGDUSD=X | AUDUSD=X | NZDUSD=X |
|------------|----------|----------|----------|----------|
| 2021-01-01 | NaN      | NaN      | NaN      | NaN      |
| 2021-01-04 | 1.000818 | 1.000704 | 1.001211 | 1.002282 |
| 2021-01-05 | 0.991772 | 1.000288 | 0.994645 | 0.997208 |
plot group 1 geo return
group1_geo_ret.plot(figsize=(10,6))
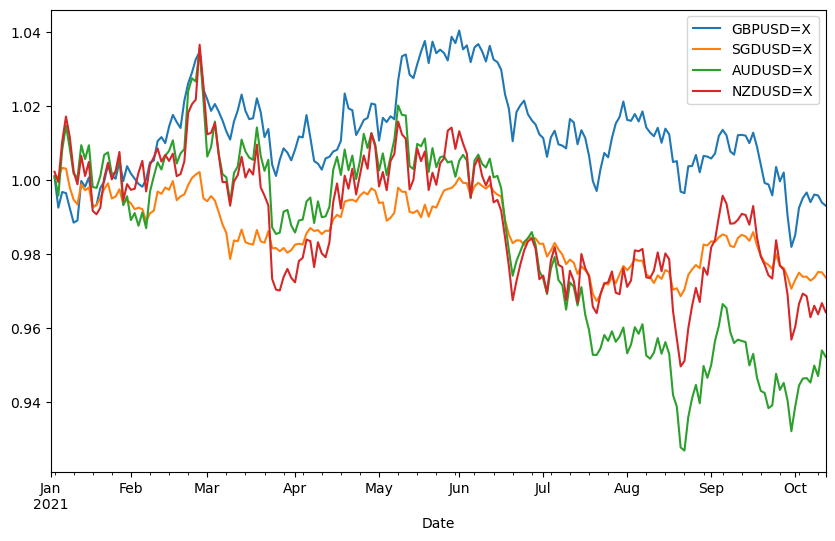
Now we can pair trade in this currency group or make decision GBP will going down like SGD AUD NZD
create return value of group2
group2_geo_ret = (group2.pct_change()+1).cumprod()plot group 2 geo return
group2_geo_ret.plot(figsize=(10,6))
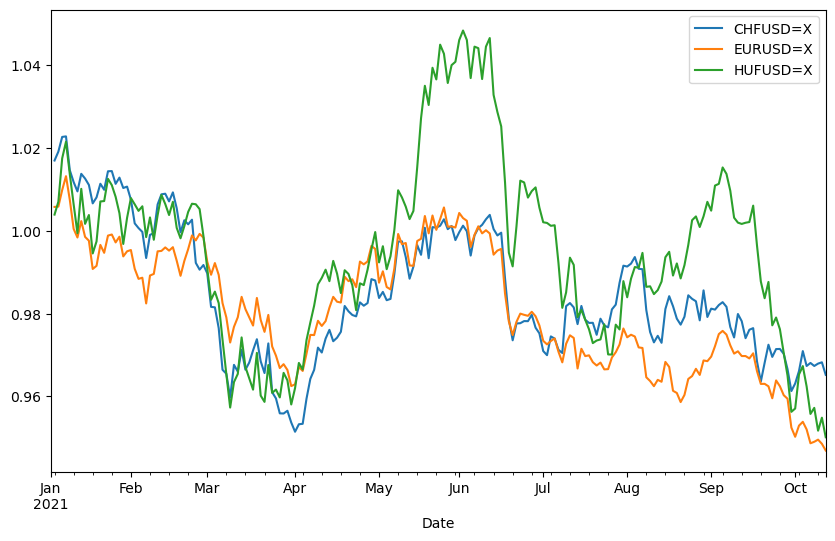
Now we can pair trade in this currency group or make decision HUF will going down like CHF EUR
the cumulative geometric returns for both groups to visualize their performance over time.
By analyzing the correlation between various currency pairs, we identified two groups of correlated pairs.
For Group 1 (GBPUSD, SGDUSD, AUDUSD, NZDUSD), we can now make informed decisions, such as predicting a decline in the value of GBP in line with SGD, AUD, and NZD. Similarly,
for Group 2 (CHFUSD, EURUSD, HUFUSD), we can anticipate a decrease in the value of HUF based on the performance of CHF and EUR.
Conclusion
In conclusion, analyzing the correlation between currency pairs can provide valuable insights for pair trading strategies or predicting the potential movement of one currency based on the performance of another. This approach can be extended to other asset classes, such as equities or cryptocurrencies, to identify potential trading opportunities.