
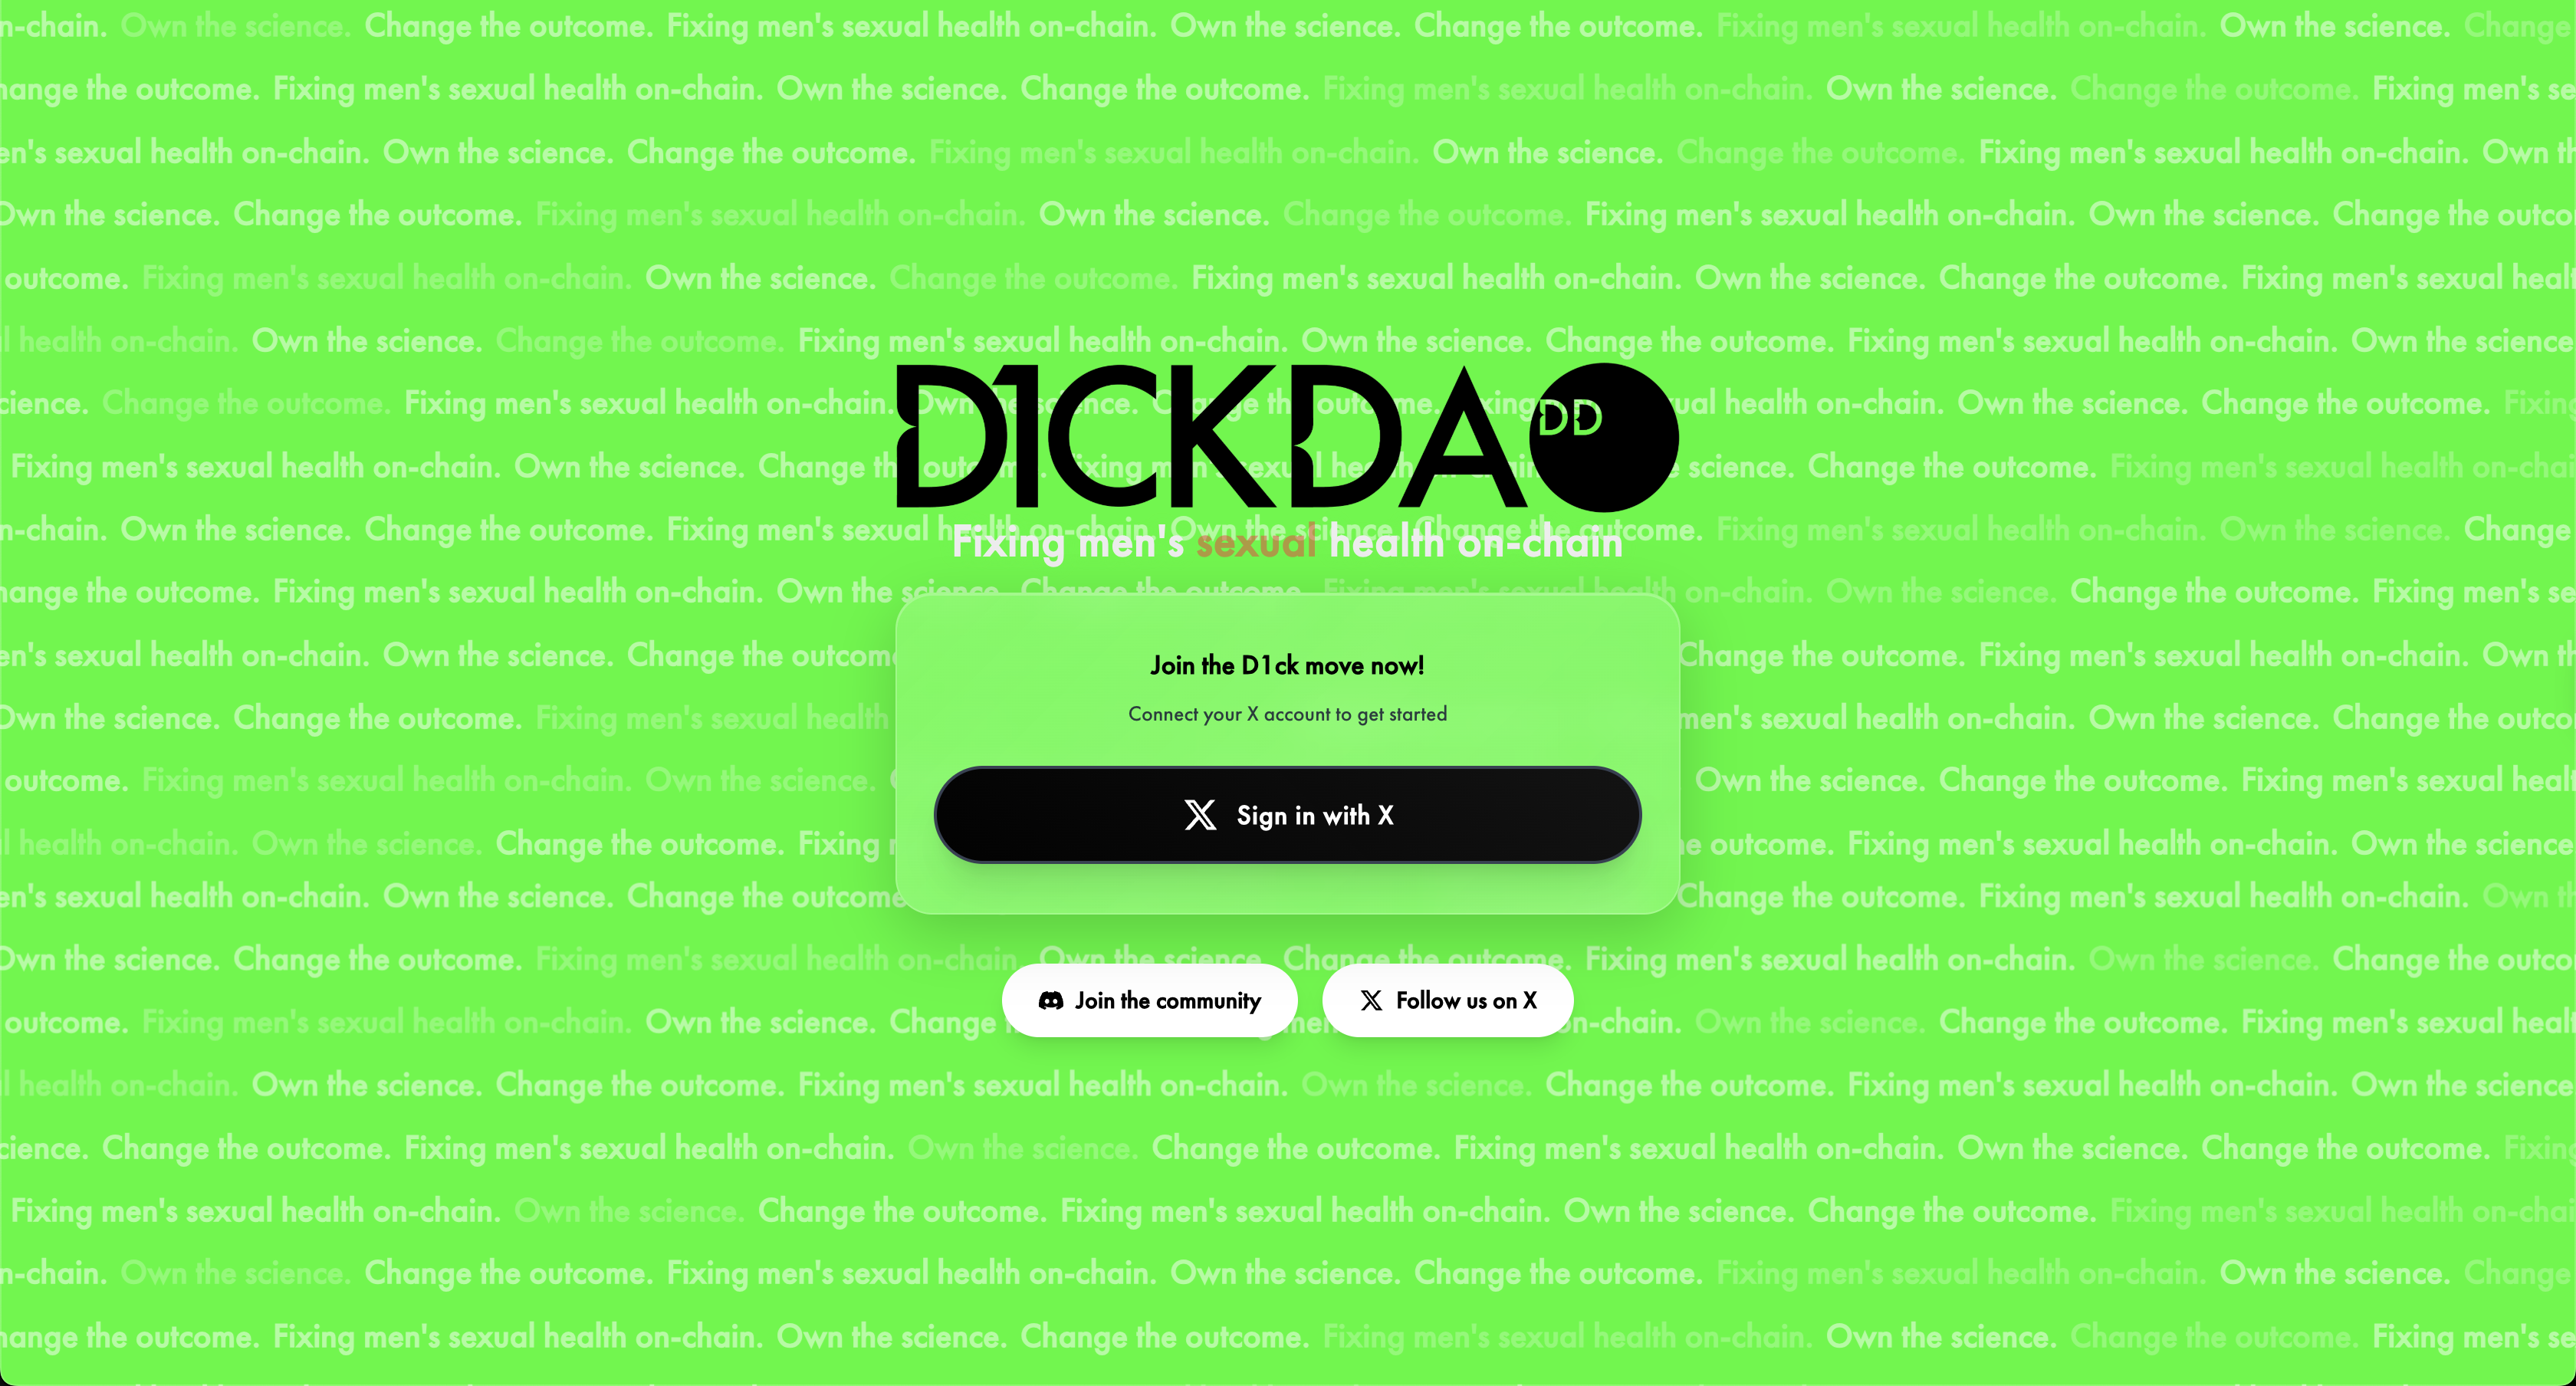
D1ckDAO - DeSci Men's Health Platform
Decentralized science platform for men's health research. Launched D1ckGPT BioAgent via BioProtocol, reaching $27M FDV. 50k+ community across platforms.
View Project


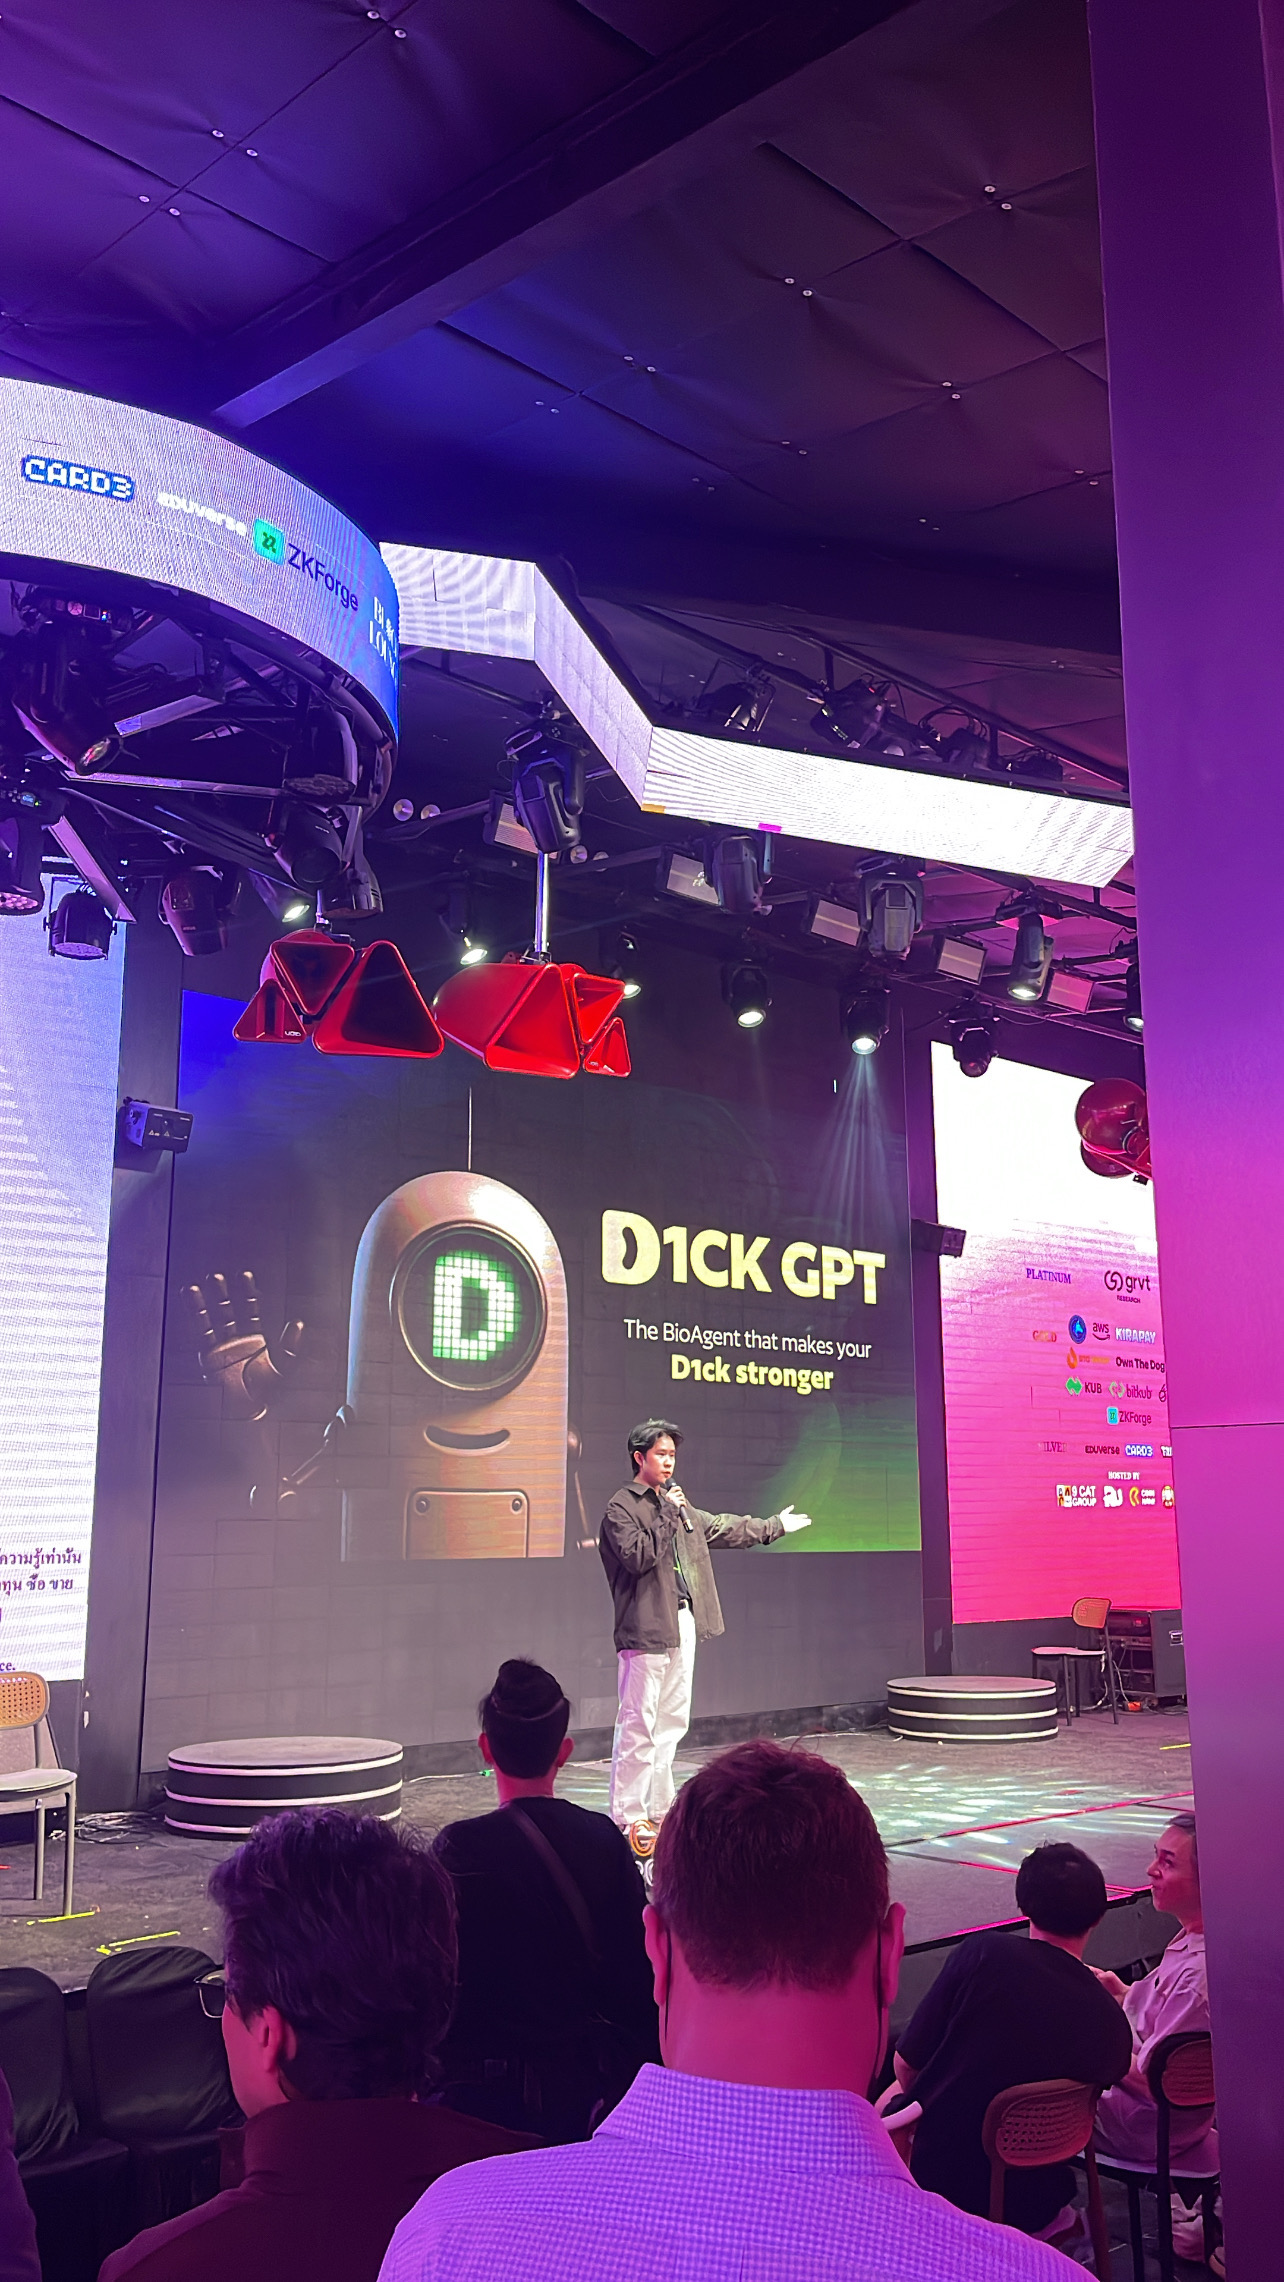


Decentralized science platform for men's health research. Launched D1ckGPT BioAgent via BioProtocol, reaching $27M FDV. 50k+ community across platforms.
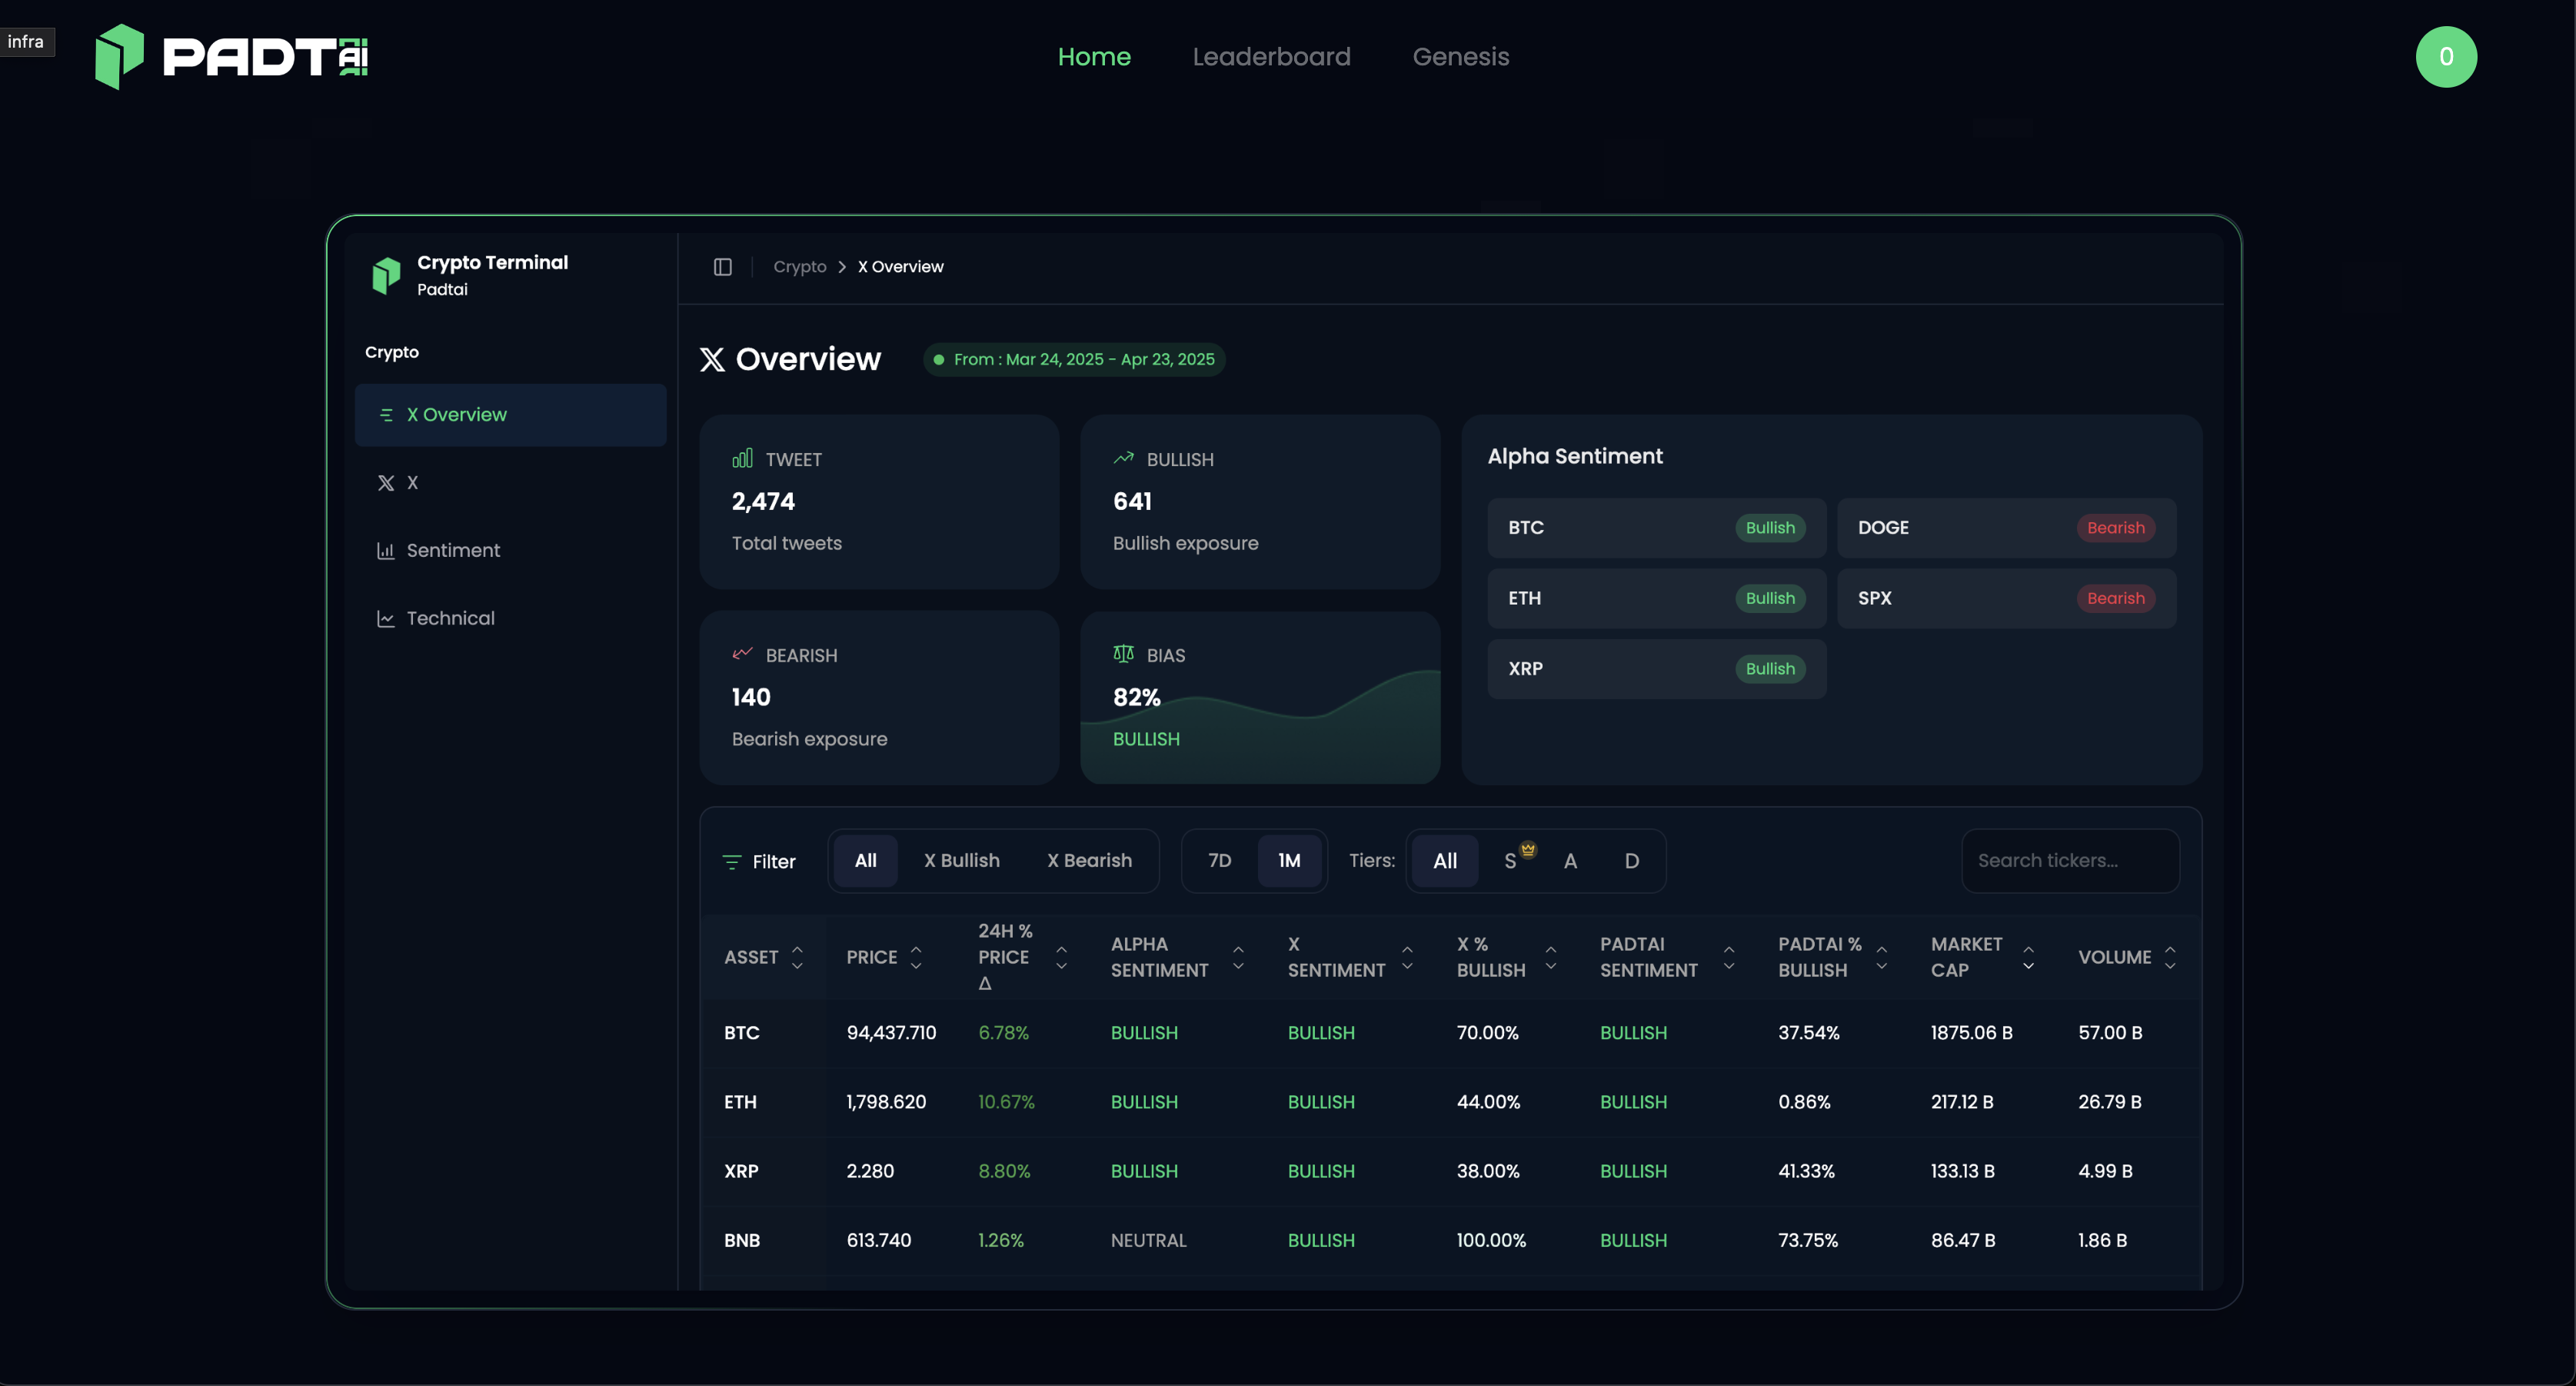
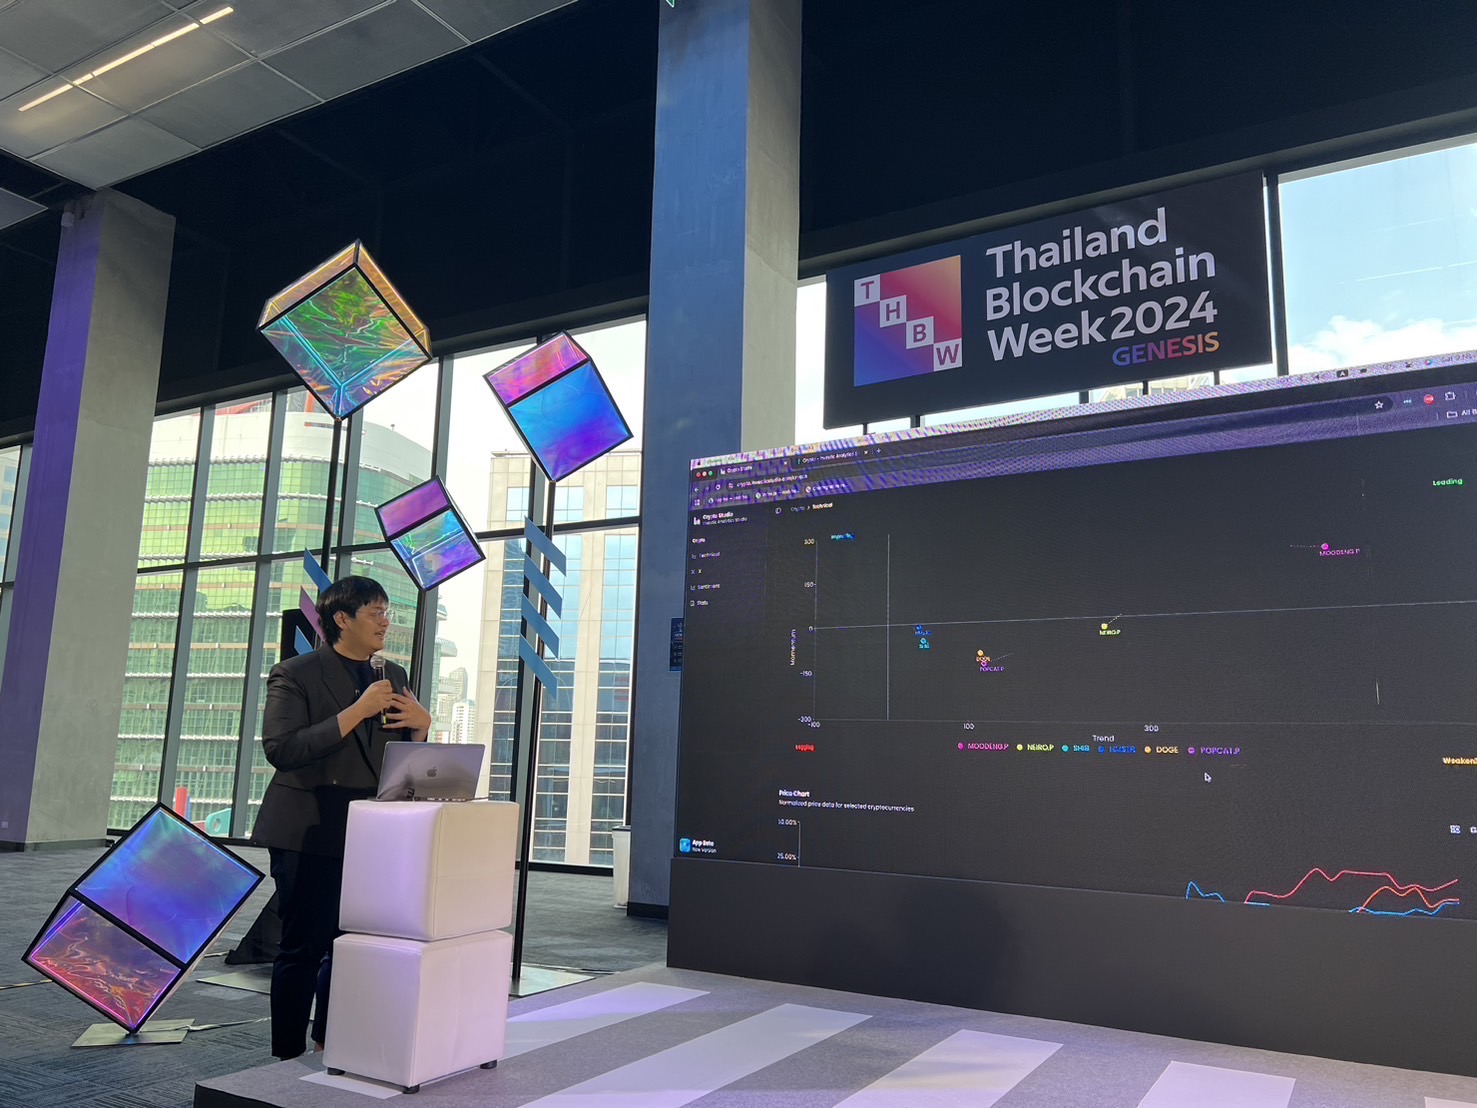
AI-powered CT copytrade terminal. Auto-copytrade top Crypto Twitter posts on Hyperliquid with built-in risk controls. Track sentiment, quant data & CT traders.
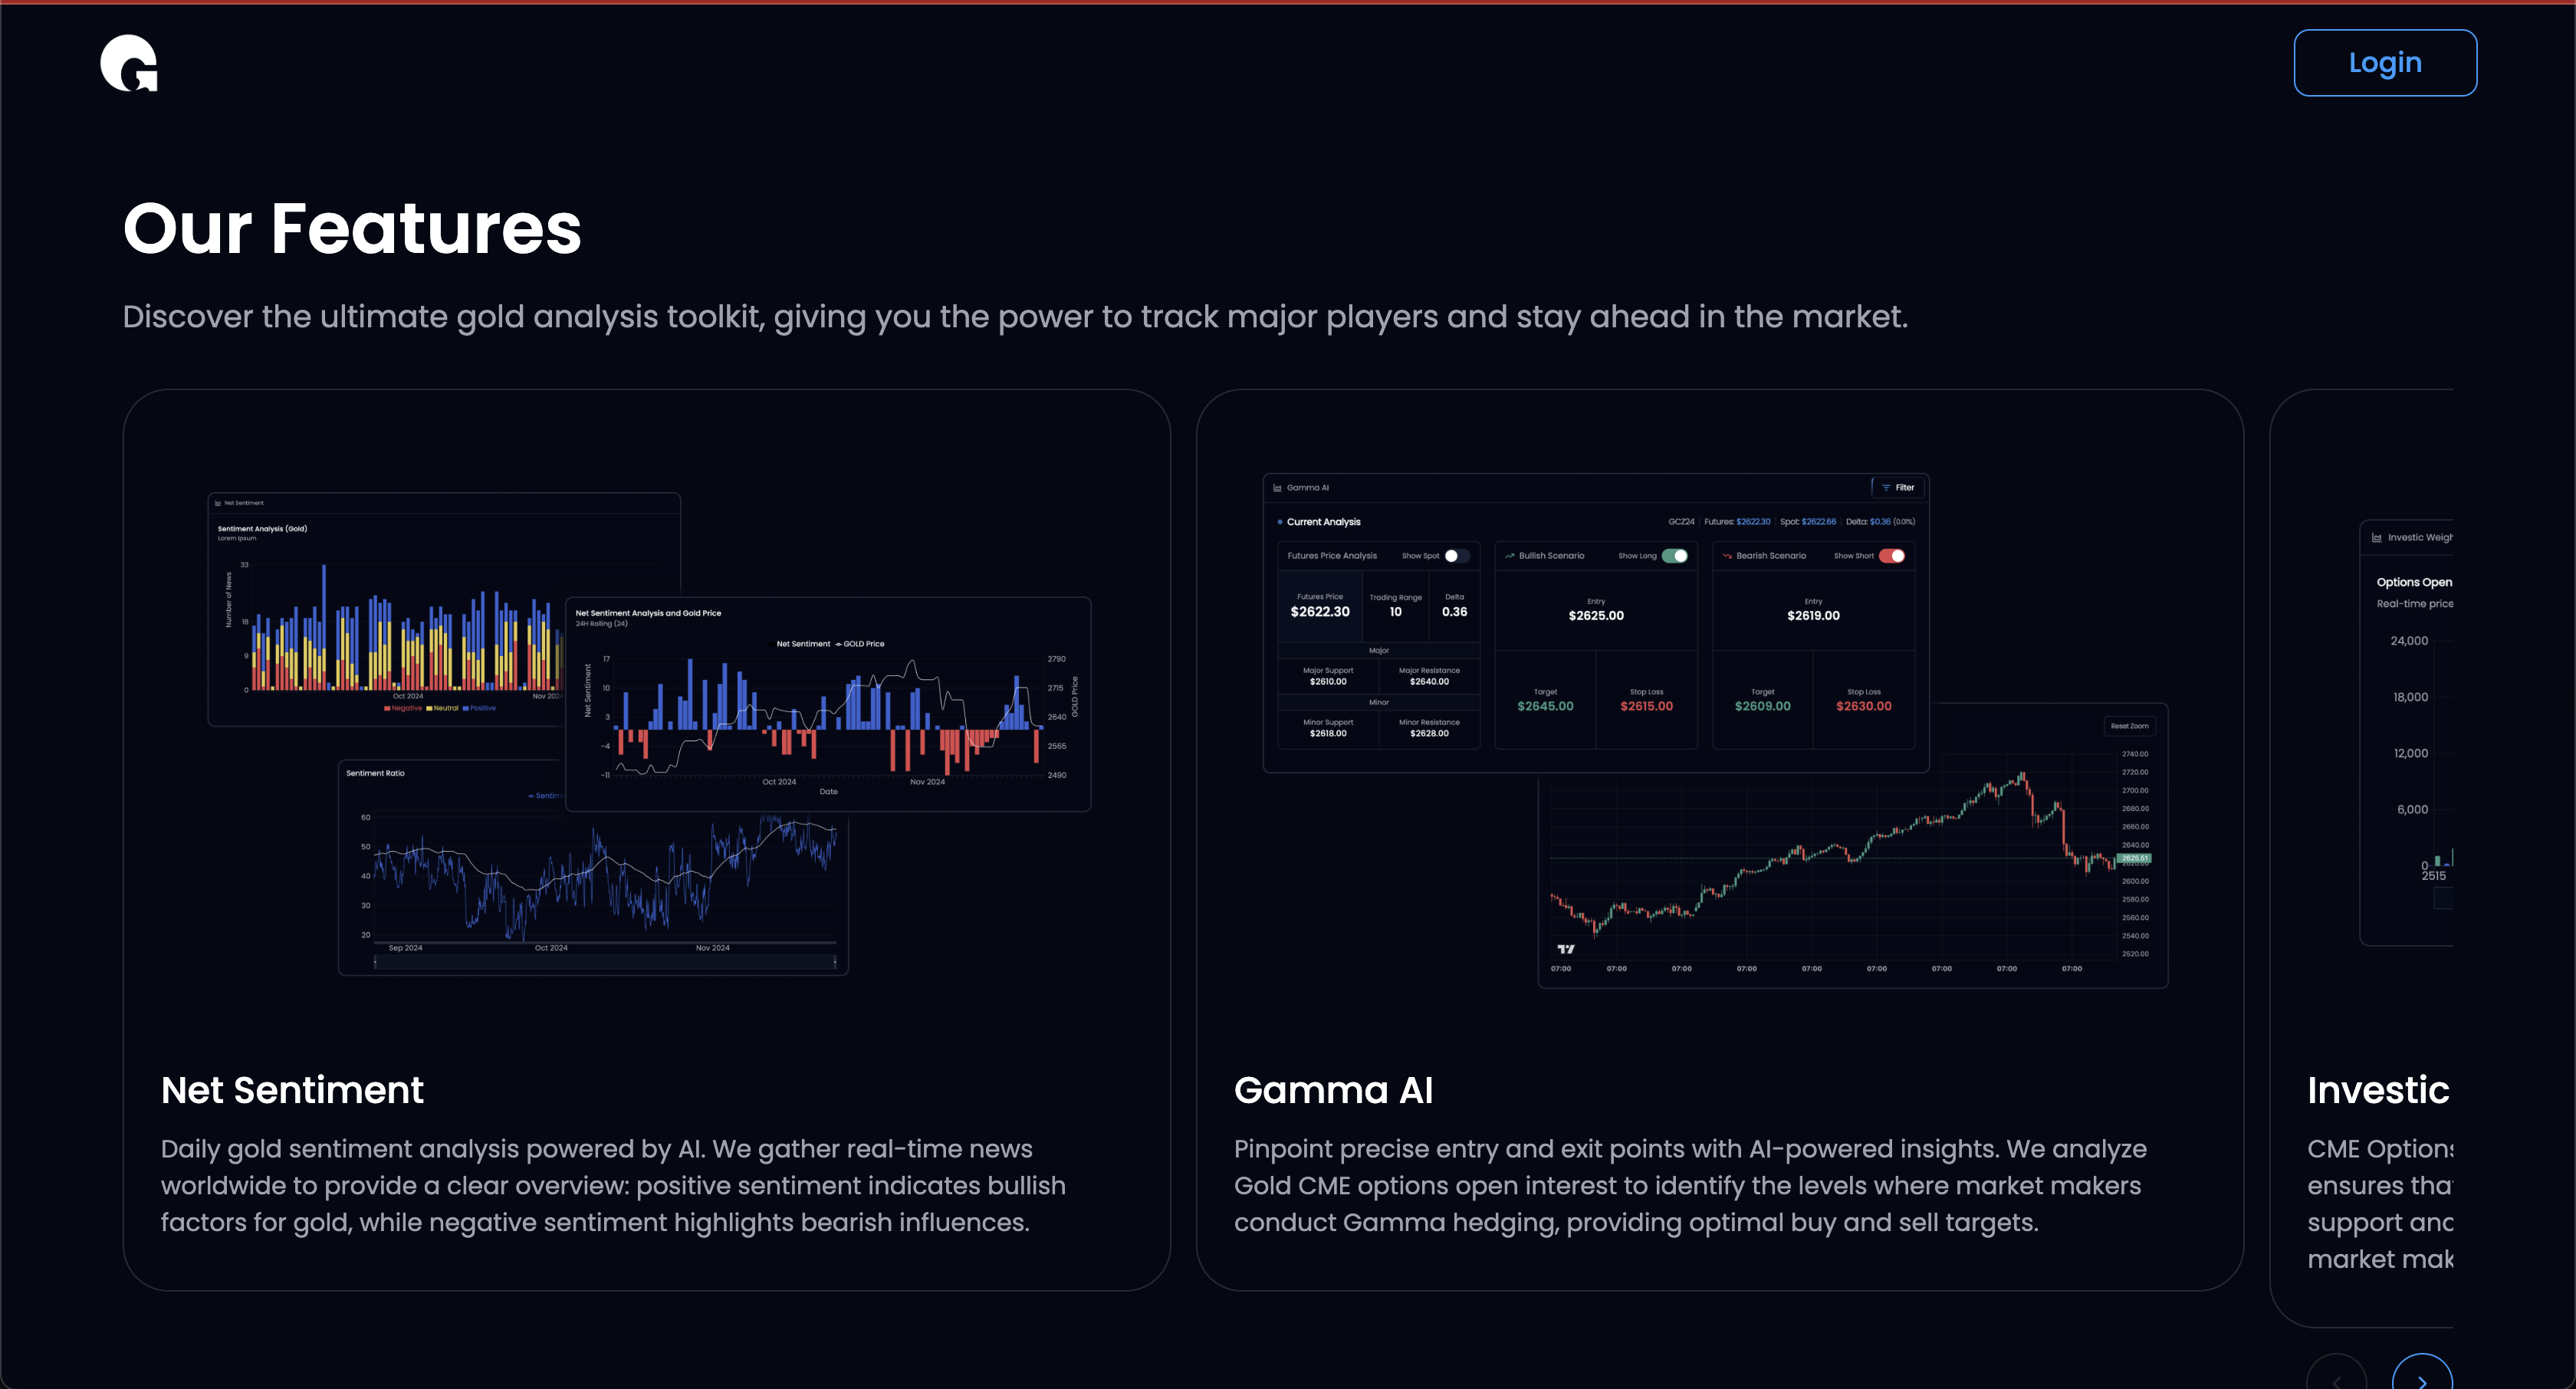
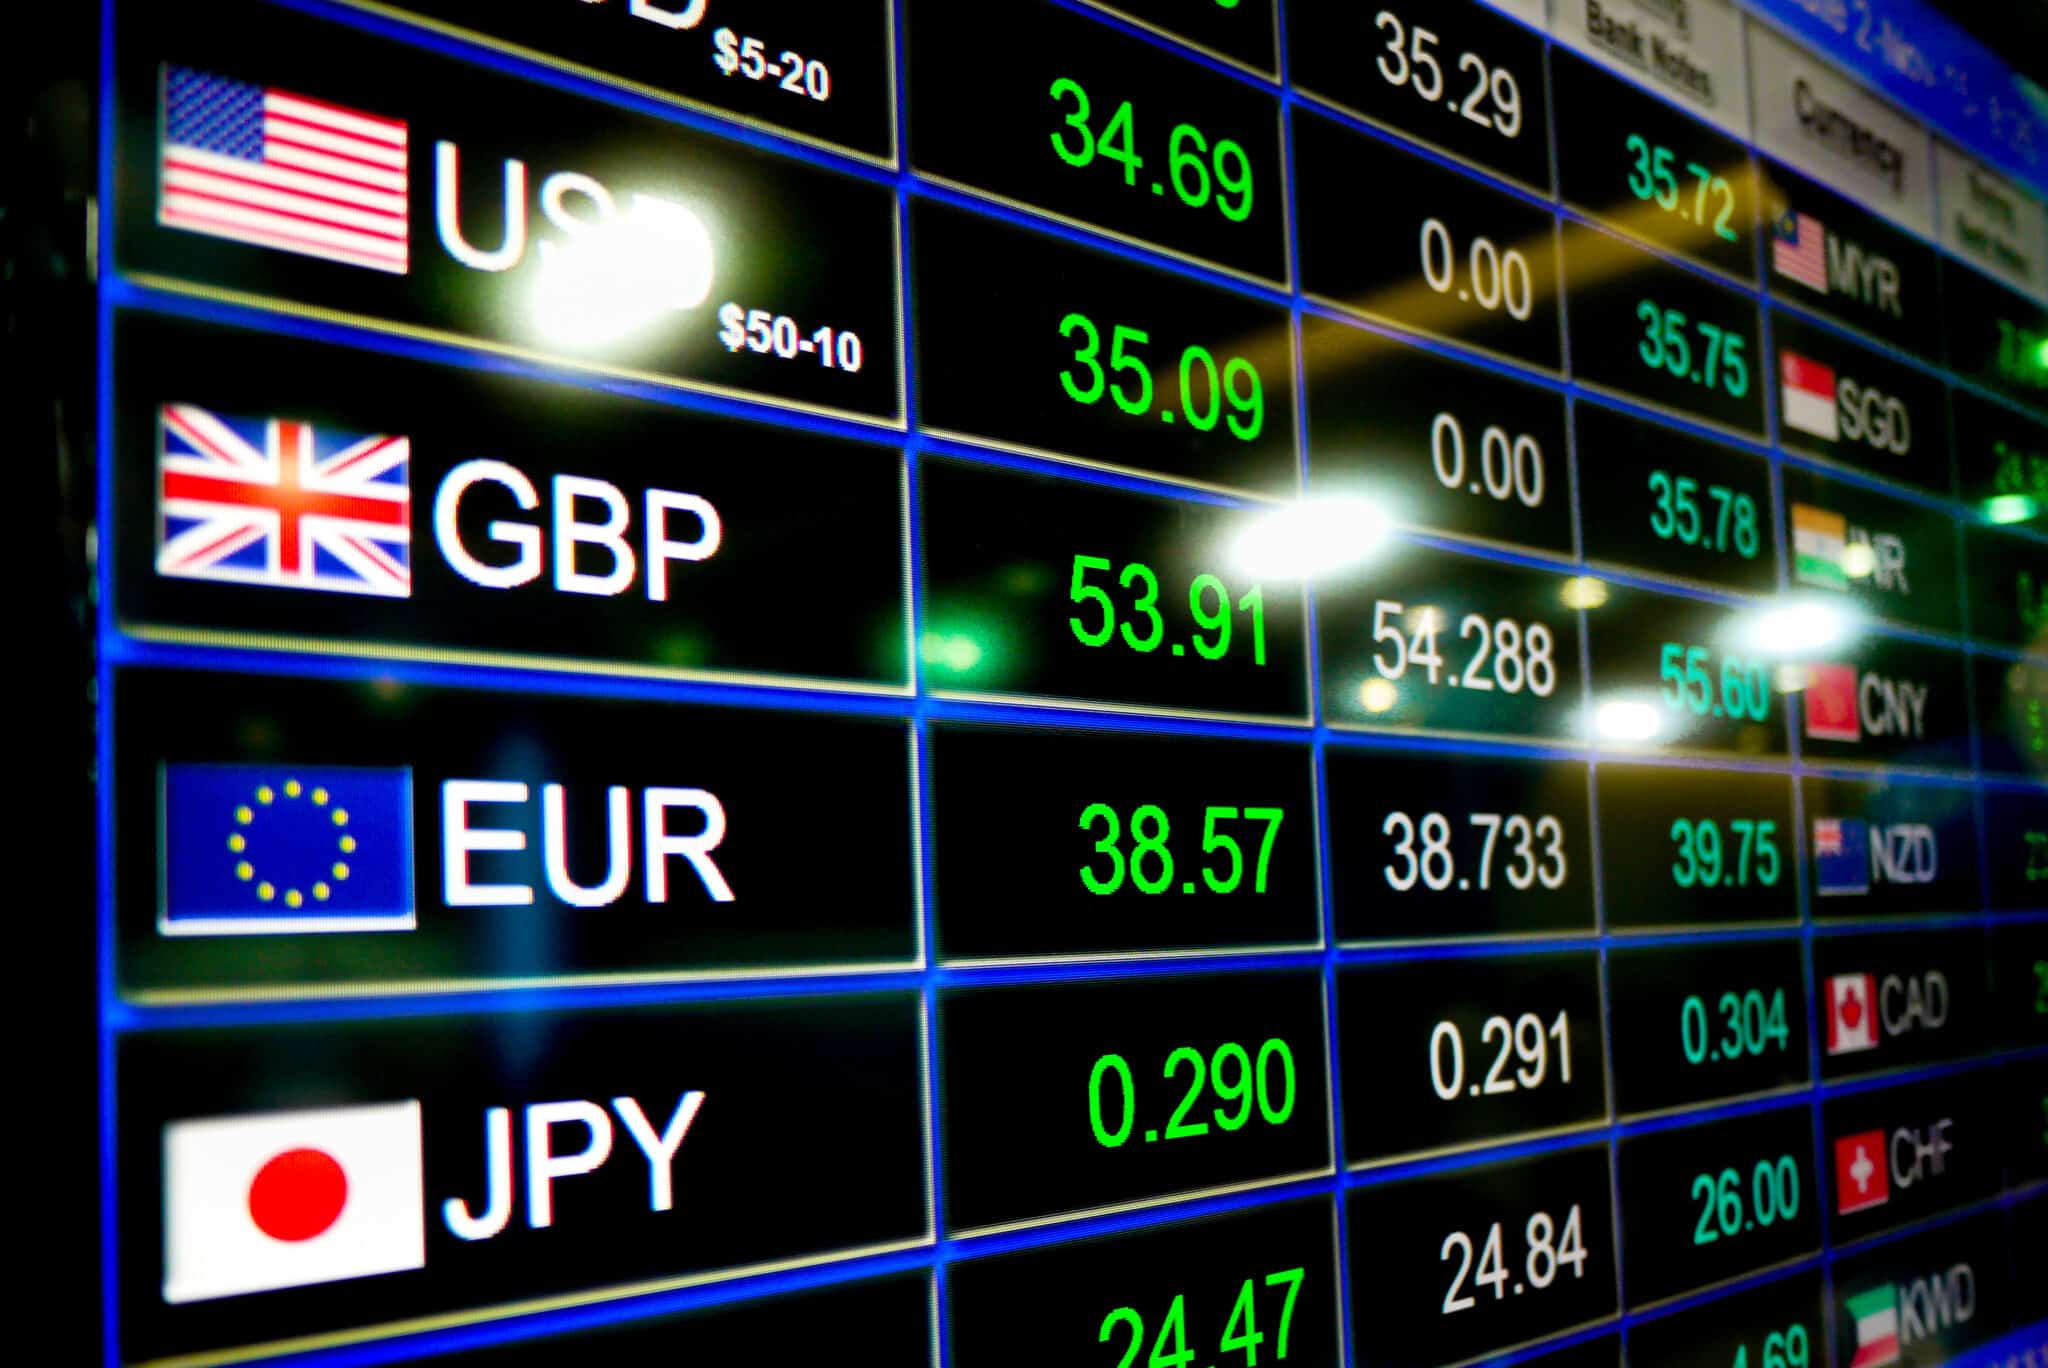
Specialized analytics platform for gold investors. Real-time gold price tracking, technical analysis, and trading signals.
Development Website With Marketplace and Subscription System with React , Mantine , with responsive UI and Backend with Golang and Stripe Payment
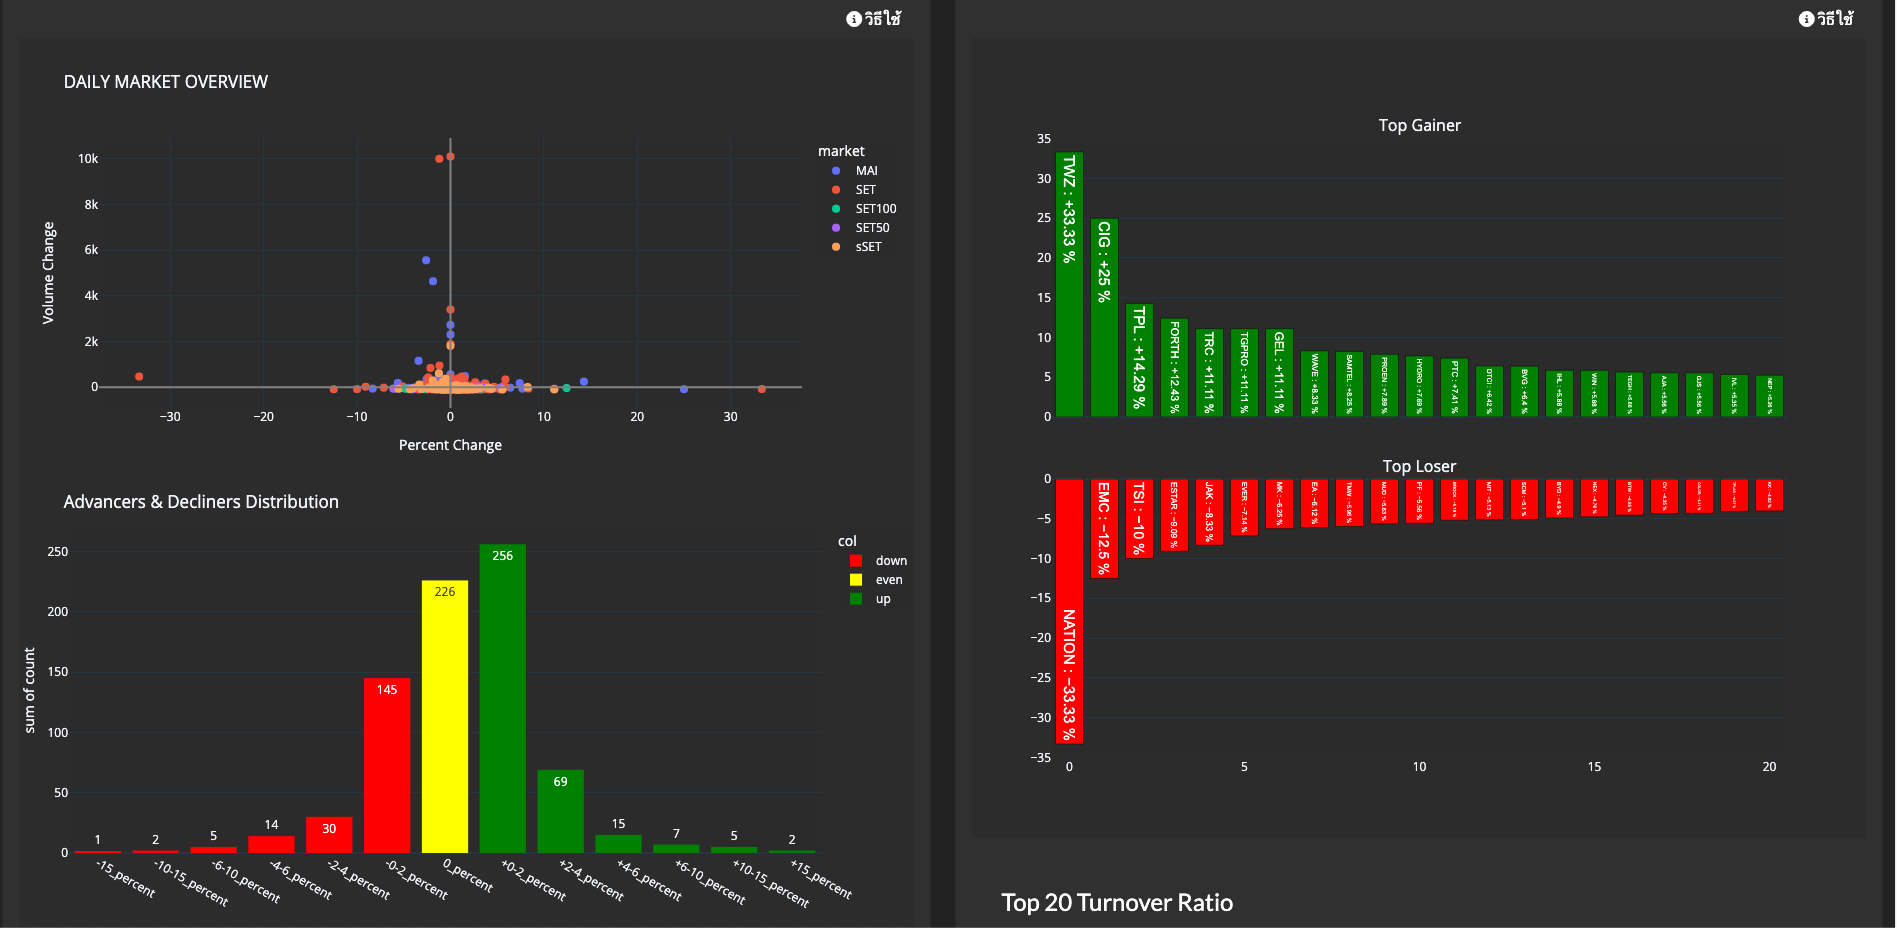
Development Data Analytic website with Python , Plotly , Dash and Data engineer with Airflow , Google Workflows
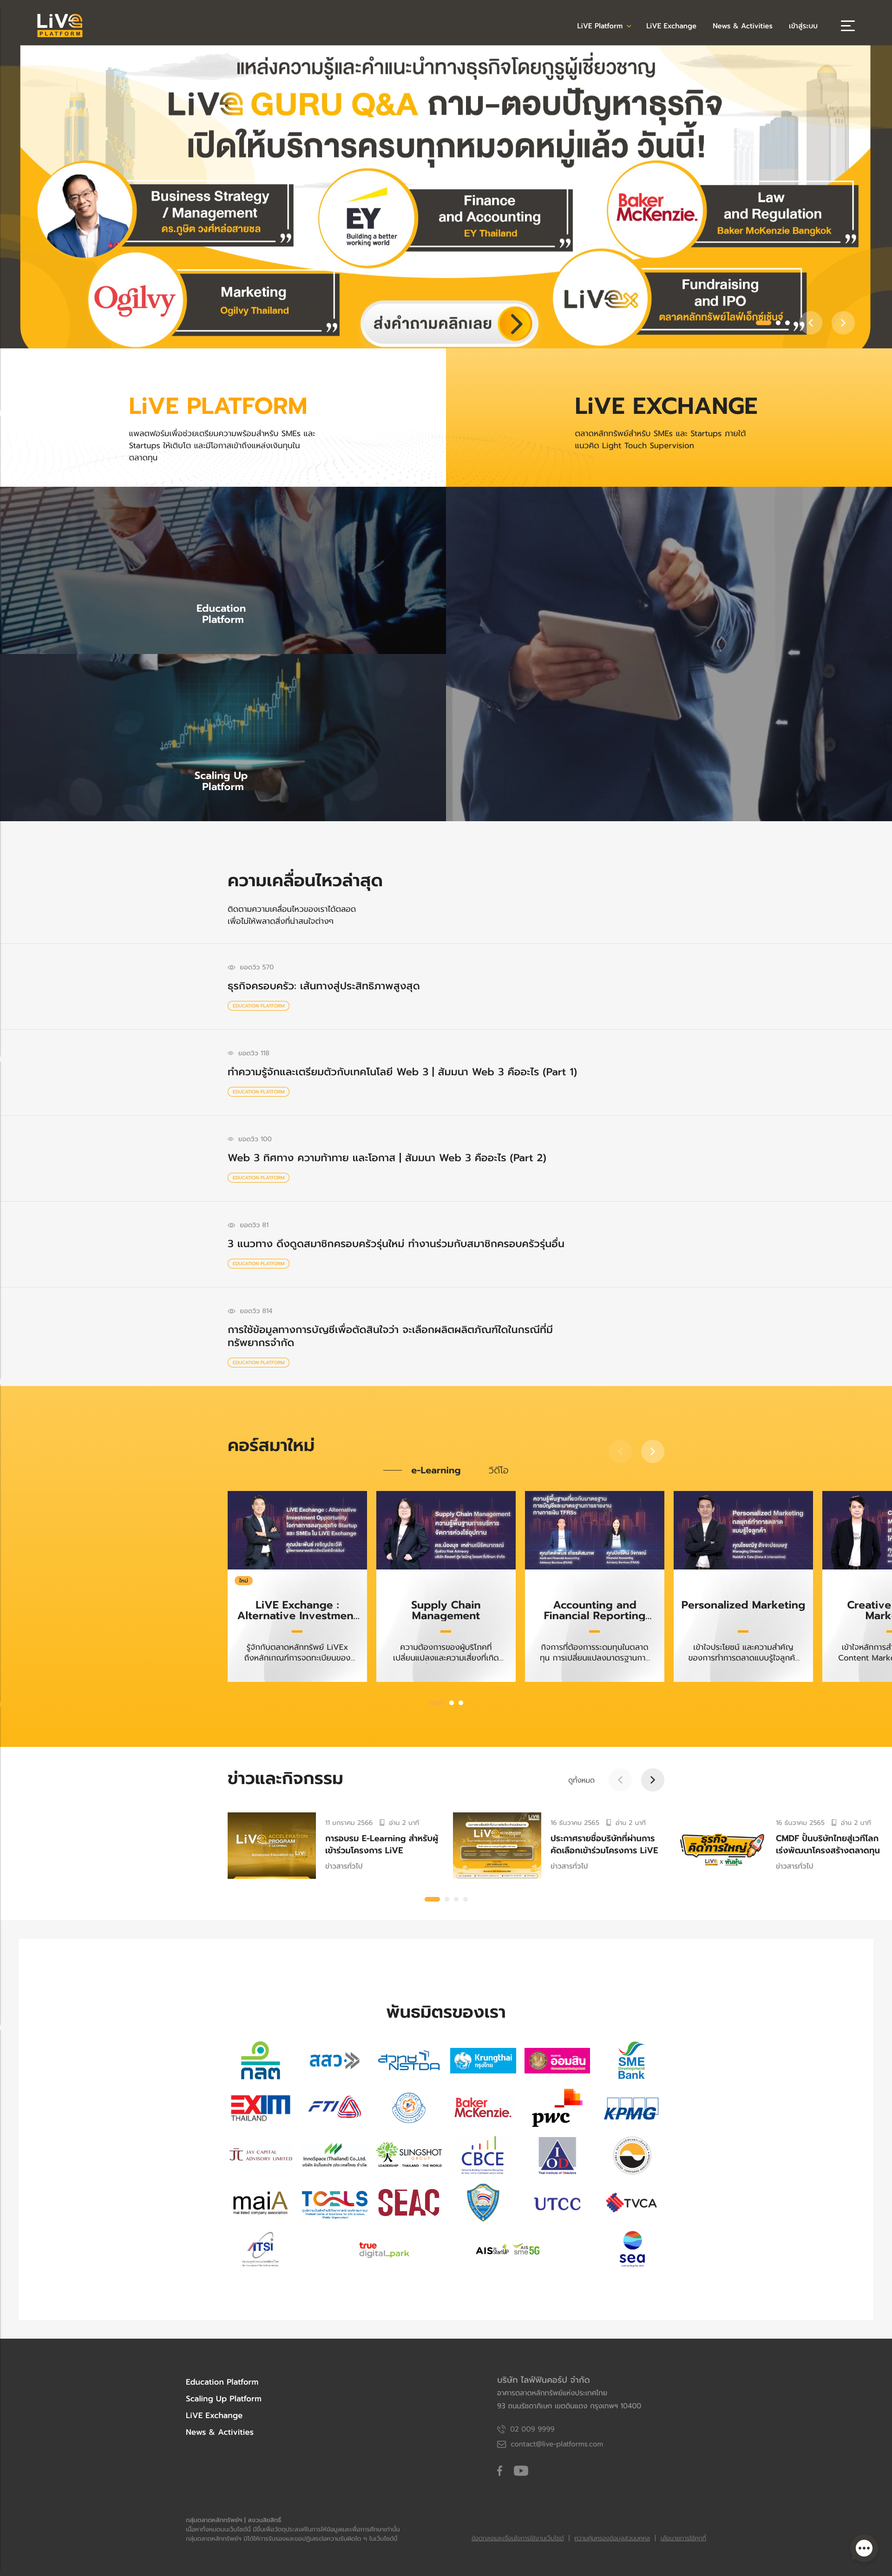
Developed a comprehensive IPO website and learning system, integrating with complex traditional systems. Created a platform that enables SMEs and Thai startups to easily access fundraising opportunities. Utilized Node.js, Express, React, and PostgreSQL to create a seamless user experience.
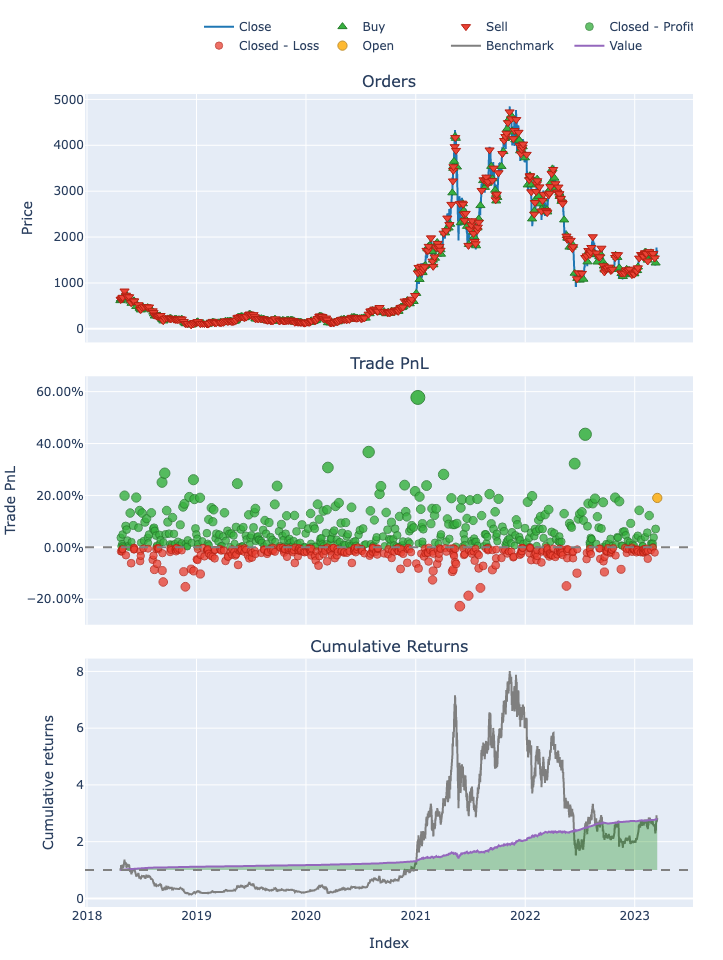
Learn how to build a machine learning model for predicting buy and sell signals in the ETH/USD market using the Random Forest algorithm. Gain insights into the application of ML in cryptocurrency trading and improve your strategies.
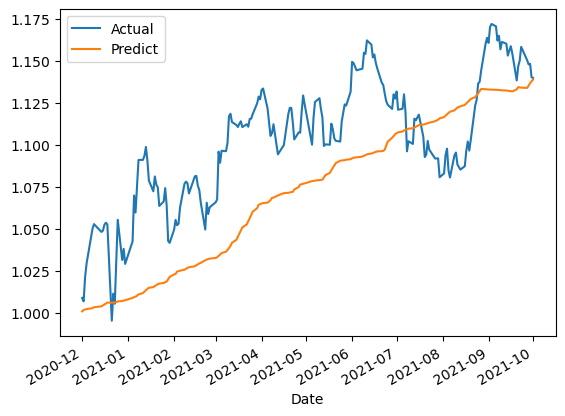
Combining Multiple Datasets, Linear Regression, and Visualizing the Results
A step-by-step guide to discovering currency pair correlations and leveraging them for informed trading decisions and pair trading strategies.

A guide to creating a data visualization that compares Google Trends data with Bitcoin price, helping to analyze public interest and sentiment in the cryptocurrency market
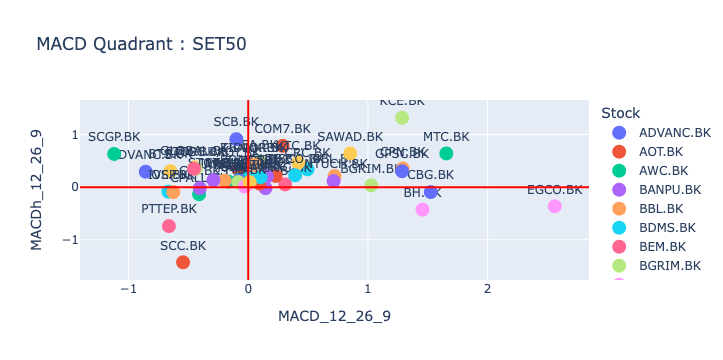
The Stock MACD Quadrant Chart represents an overhead analysis of MACD, including multiple Stock in a single chart.
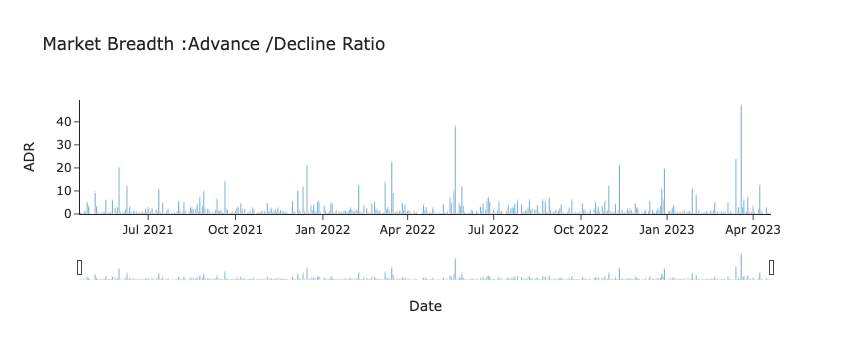
Discover how to analyze market trends and investor sentiment using Python and popular libraries like Pandas and Plotly Express. Learn how to calculate the Advance/Decline Ratio (ADR), an essential market breadth indicator, and create insightful visualizations to identify trends and make informed investment decisions.